Mirus Industry Analysis January 2019 (MIA)
February 7, 2019 | Aged Care Finance

We received wonderful reviews for our aged care industry analysis for last month. Thank you. We always bring the industry analysis at the beginning of the month and the data used will be that of the previous month. For example, we have released MIA January 2019 today, using data from the month of January. Please send us your comments and suggestions as we look forward to giving you maximum value from this blog. In case you prefer watching videos, please head over to this link.
ADS & Occupancy
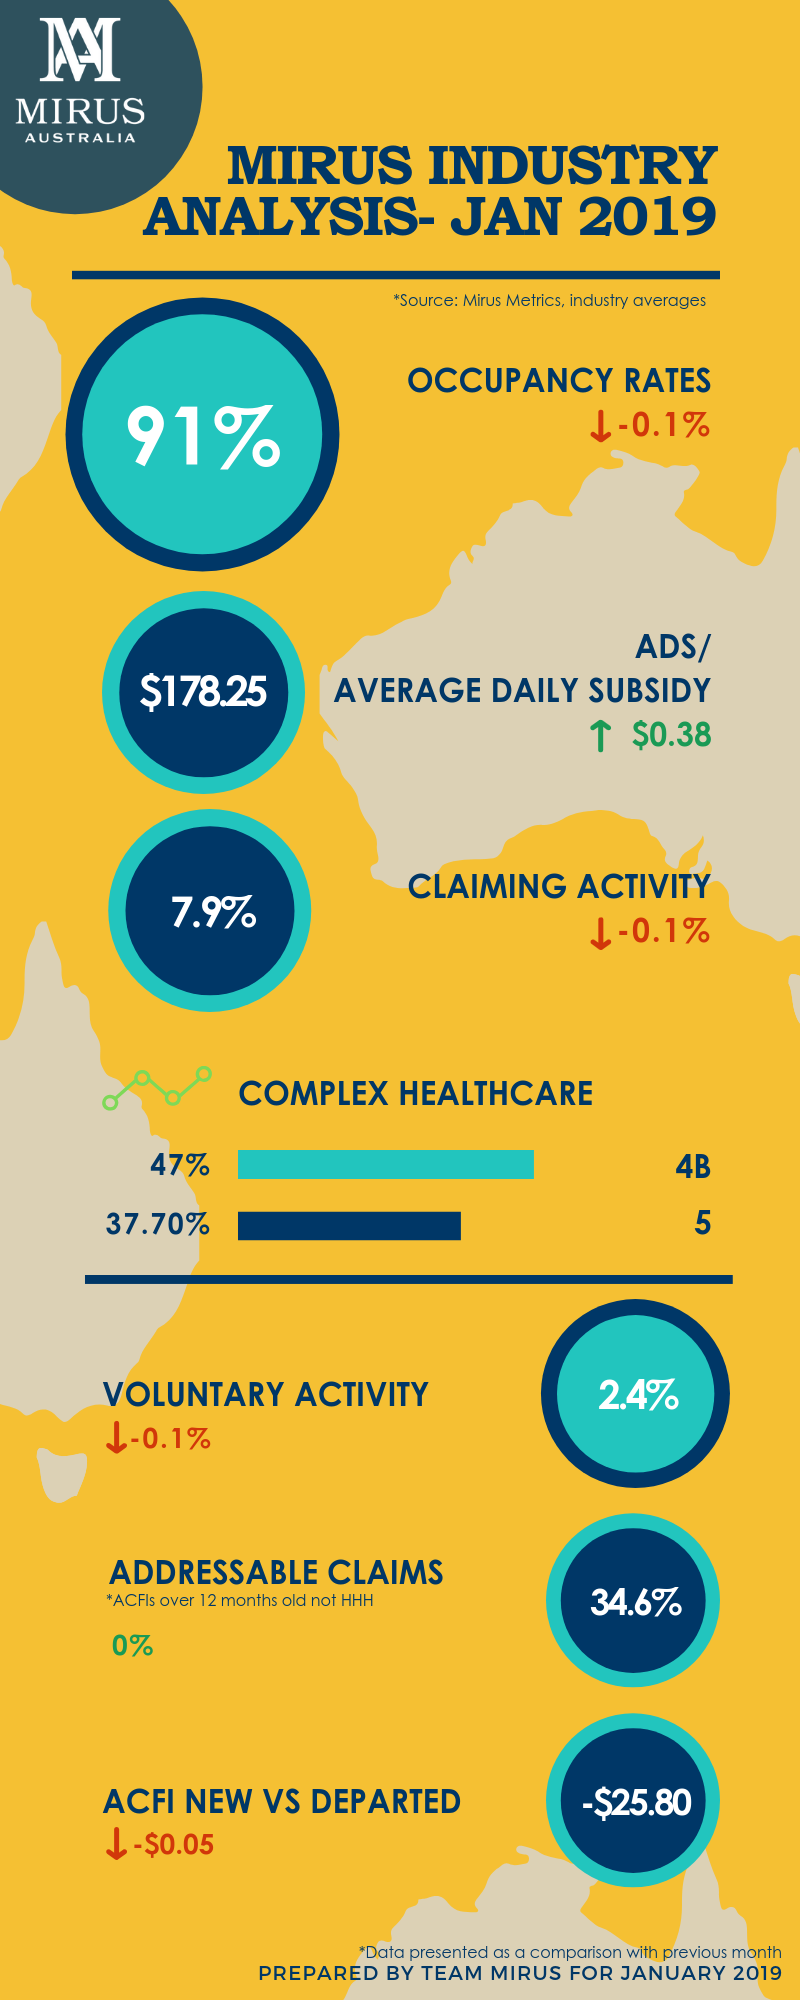
The Average Daily Subsidy was up across the industry (including both not-for-profits and private operators) at $178.25. Occupancy continues to see downward pressure across the industry from the last six months. For the not-for-profits, it is at 92.9%, the private operators held steady at 88.6% and the industry average is at 91.1%.
Since June 2018, occupancy has been steadily going down. We tried to unpack this by looking at the private operators and specifically at those facilities with less than 60% occupancy. We assumed these operators are refurbishing or commissioning their site; meaning a number of their beds are available but cannot be filled. These facilities were filtered out of the data, and the average occupancy for private operators increased from 88.6 to 90%. We will continue to watch these trends and review it from our end, but we are looking forward to your insights to this data too (send your suggestions here).
(To learn more about Mirus Admissions Companion powered by Salesforce to assist you with CRM or customer relationship management, please click here.)
Claiming Activity
Overall ACFI activities were also seen to be mixed in January 2019, including both voluntary and mandatory claims, across all sectors. The industry average which was at 8.0% in December has dropped down to 7.9% in January. The private operators at a claiming activity of 10% had a rise of 0.6% activity from December. They are leading when compared to the not-for-profits who are currently only at 7.1% activity.
Voluntary Claims
The voluntary claiming activity or proactive claiming was also mixed across the industry. The private operators have increased slightly to 2.9% from 2.7% while the not-for-profits have dipped to 2.3% from 2.4%.
Addressable Claims
The overall percentage of addressable ACFI Claims (greater than 12 months not HHH indicating they are eligible for voluntary claiming), was quite flat too; which reflects the overall dip in claiming activities. The industry is at 34.6% in January compared to 34.5% in December; almost flat from the previous month.
Variance: New Vs Departed ACFI
When we look at the average ACFI of new residents compared to departed, we calculate the variance of the ADS between these two segments. The industry average variance between new versus departed ACFI is at $25.80. This figure is tighter and looks better for the private operators at $21.81 whereas for the not-for-profits, it is at $27.45. For a benchmark level, the Mirus ACFI experts suggest a variance of $20 to be maintained as a good performance indicator for your facility. If you’d like to read more on ACFI optimisation, click here.
Complex Health Care Domain
Within the question 12 and the complex healthcare domain, we’ve seen the 4B and pain management claims continuing to grow across the industry at 47%. The private operators are leading at 50% and the not-for-profits are not too far behind at 46%.
Workforce Trends
There were mixed trends in workforce during January 2019. Non-care hours increased by 3% while care-hours per bed per day dropped by 2% compared to December 2018. We did unpack the care-hours, to see that the RN hours declined by 3% and the agency hours significantly dropped by 61% owing to the holiday break.
If you would like to get in touch with us please do so here.
Drop in a topic request for our blogs here.
See you next month!
-Team Mirus