Mirus Industry Analysis July 2019 (MIA)
August 29, 2019 | Aged Care Finance
Mirus Industry Analysis or MIA is our monthly video + blog series that brings to you all figures and statistics related to the industry. The new Financial Year has started and we have created a unique guide which you can use to map your people + technology to the 8 new aged care quality standards.
For all support queries please contact our team here. Please send us any questions you might have regarding the information on MIA here.
[To watch the full video, click here.]
ADS & Occupancy
The Average Daily Subsidy was up across the industry at $179.85; with the private operators leading at $188.56 and not-for-profits at $175.91. But if we remove the 1.5% indexation, we have slightly gone backwards as an industry.
Whereas Occupancy was down on all 3 cohorts, with the not-for-profits leading at 91.37%, the private operators at 88.46% and the industry average is at 90.43%.
(To start your journey to become an absolute ACFI champion, please click here.
To read our latest free support guide produced to map your resources to the 8 new aged care quality standards, click here.)
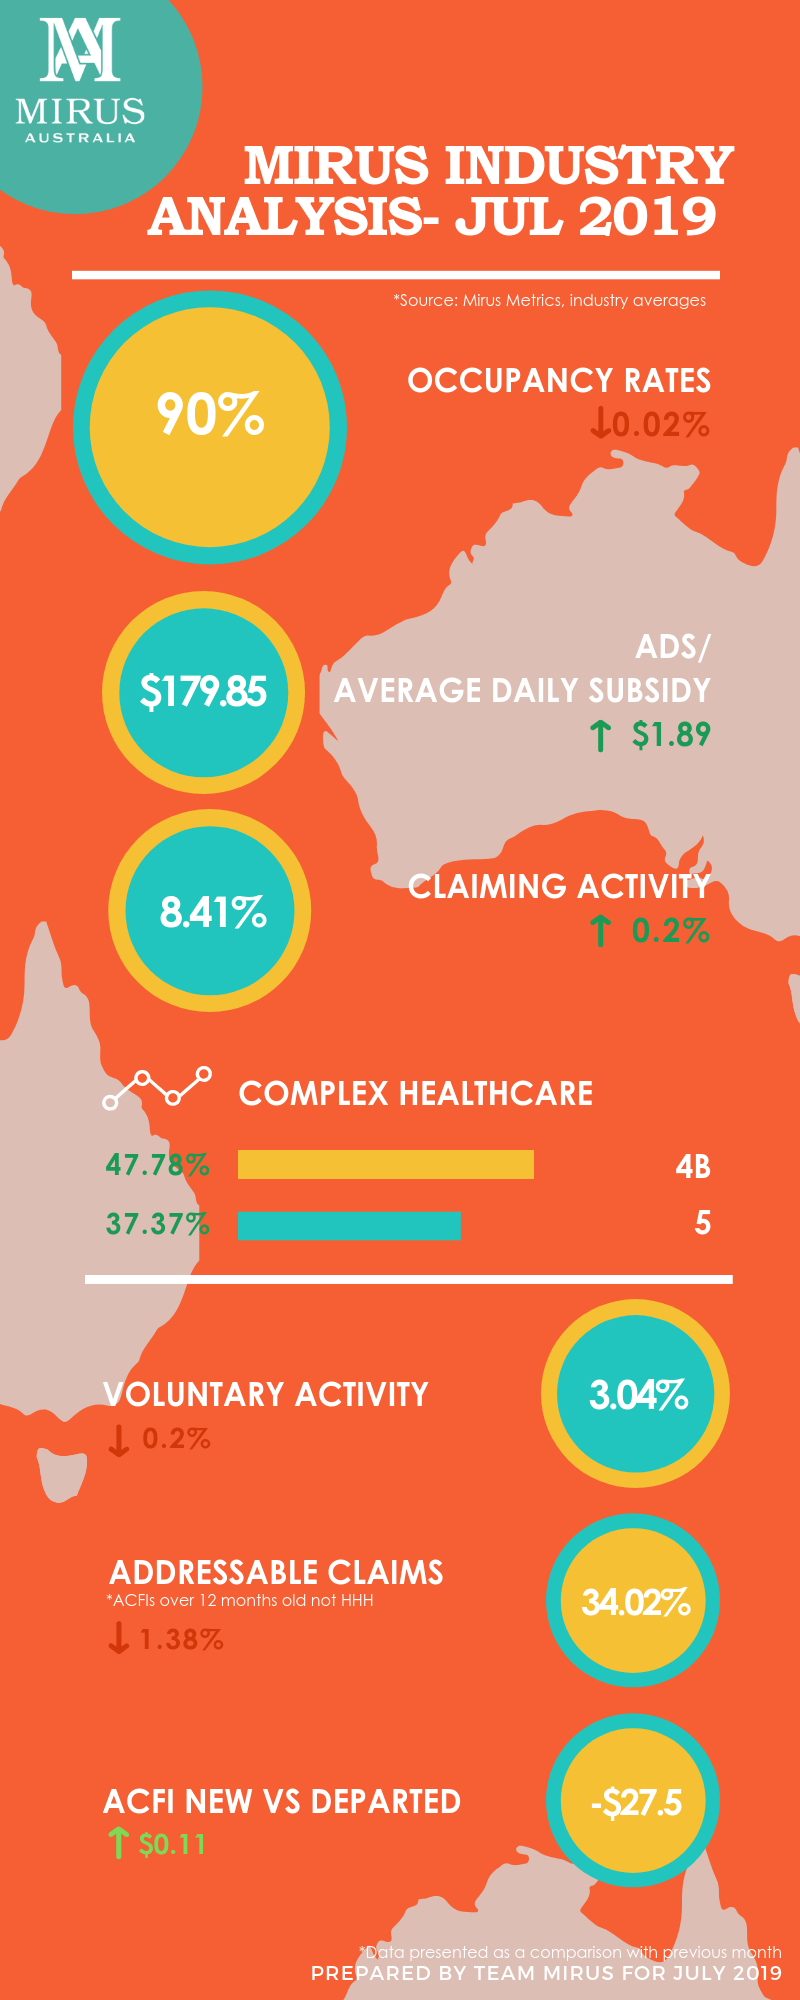
Claiming Activity
There was an upward trend in claiming activities in July 2019. The industry average is at 8.41% with the private operators at a claiming activity of 10.14%. They are leading when compared to the not-for-profits who are currently only at 7.76%.
Voluntary Claims
The voluntary claiming activity or proactive claiming declined across all 3 cohorts, the industry average being 3.04%. Most of the claims in this periods were structured as mandatory claims and hence the decline.
Addressable Claims
The overall percentage of addressable ACFI Claims (older than 12 months not HHH indicating they are eligible for voluntary claiming), declined in all 3 segments, with the industry average went down to 34.02%. The not-for-profits went down to 36.73% while the private operators went down to 27.42%.
Variance: New Vs Departed ACFI
When we look at the average ACFI of new residents compared to departed, we calculate the variance of the ADS between these two segments. In this period we could see a correlation happening with downward occupancy and increasing variance of new Vs departed ACFI rates to $27.50. This happens typically because the facilities start opening up to clients with lower ACFIs.
For a benchmark level, the Mirus ACFI experts suggest a variance of $20 per day to be maintained as a good performance indicator for your facility. If you’d like to read more on ACFI optimisation, click here.
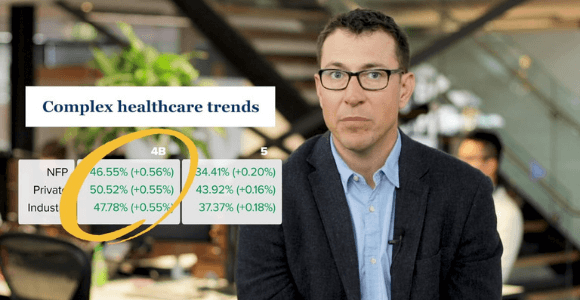
Complex Health Care Domain
Within the complex health care domain, we’ve seen a steady growth in the 4B procedures, with the industry average is at 47.78%. The private operators are at 50.52% & not-for-profits are at 46.55% of all claims having a 4B claim attributed to it within the medicare data. The continence 5 claims also increased, with the industry average at 37.37%. The private operators are at 43.92% and the not-for-profits are at 34.41% here.
Workforce Trends
There were steady growth in both care and non-care hours during July 2019. Non-care hours were up by 11.11% (0.85 hours) and the care related hours were up by 6.68% (2.46 hours). If we unpack the care related hours, the RNs were up by 8.87% (0.61 hours), the enrolment staffing had a retreat of 35% (0.01 hours). However the Allied Health hours dropped by 2.89% (0.02 hours) and agency hours had a decrease of 12.95% (0.0 hours), and the AIN hours were up by 6.05% (1.69 hours).
With the decline of occupancy throughout the industry, we urge providers to have a look at their CRM & see if it’s working for them. Please use our CRM Self Diagnosis Tool for the same and also use this customer support guide we created as a response to the 8 new Aged Care Quality Standards.
If you would like to get in touch with us please do so here.
Drop in a topic request for our blogs here.
See you next month!
-Team Mirus