Mirus Industry Analysis (MIA) – November 2025 edition
November 13, 2025 | Mirus Industry Analysis (MIA)

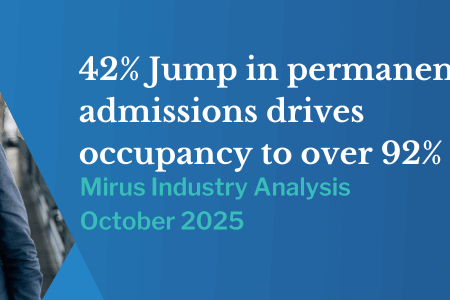
Occupancy still rising, fuelled by a 20% increase of permanent admissions in October
Rob Covino presents Mirus Industry Analysis (MIA), a series of monthly insights into the key performance indicators and cumulative industry trends from the 90,000+ beds we monitor for financial sustainability.
Welcome to the November 2025 edition.
Revenue
When analysing ADS and claiming activity, the more recent month is always artificially lower due to the nature of reassessment requests, which are typically uplifts, being backdated several weeks to their effective date. We see a month’s average funding rise through the following two months as uplift requests that were made in the initial month are actioned. This also applies to the measurement of ‘Days from Request to Reassessment’.
Occupancy
Workforce management
Total care time increased from September to October and RN time also increased, with total time increasing by 5.68 % and RN time increasing by 4.17%. This increase in care delivery came at the same time as the subsidy price indexation, which saw the average daily subsidy for the sector increase by $9.23 or 3.06%.
As a MIA subscriber you will have access to the full data set breakdown as a downloadable PDF
About Mirus Industry Analysis (MIA)
With one of the largest aged care databases in Australia, each month we bring you MIA – a monthly wrap up of insights captured from data covering 90,000+ beds.
| Please note: This video uses AI-powered technologies, including an AI-generated presenter to replicate a real person’s image and/or voice, to deliver industry analysis. Some or all of the visuals and voice in this presentation may be computer-generated. |