

Your whole operation, visible at every level
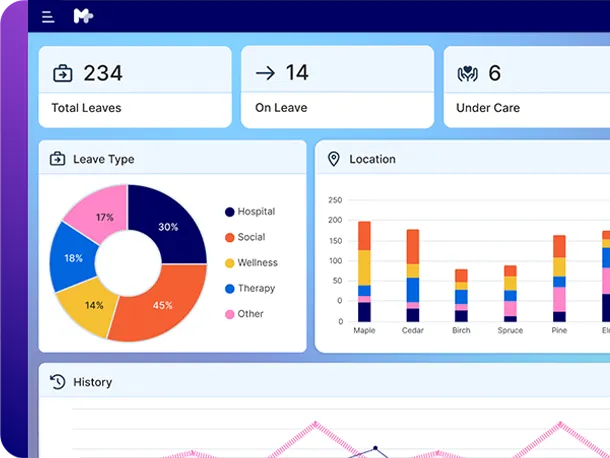
Bring dashboards, reports and performance alerts together so clinical, workforce and financial performance is visible across every site, as it happens.

"Mirus Australia has saved us countless hours in manual reporting and ensured we are always ahead of funding changes, allowing our teams to dedicate more time to quality care."
Why choose MirusPlus for Business Intelligence?


Complete visibility across your organisation

Power smarter decisions
Trusted insight at every level
MirusPlus Business Intelligence & AI brings together dashboards, reports, alerts and analysis so performance is visible at every level.
Built-in Dashboards
- Real-time dashboards across clinical, workforce, financial and governance areas
- Filter by home, wing or organisation
- Visualisation of key metrics, trends and exceptions
Reports
- Around 300 pre-built reports
- Quality indicator reports that mirror the NQIP portal
- Run, preview and print without building anything
Reporting & Analysis
- Pivot grids and timeline charts on every list view
- Trend analysis and performance monitoring
- Exportable reports for executive, board and compliance use
Data-as-a-Service
- Secure access to structured, validated datasets
- Governance, data quality and access control maintained
- For use in external business intelligence systems
Performance Alerts
- Configurable thresholds for key clinical, workforce and financial metrics
- Automated notifications for variances, risks and compliance exceptions
- Site, service or organisation-level alerts to support timely action and escalation
Power BI
- Native integration with Microsoft Power BI
- Custom dashboards and reports using live platform data
- Support for executive and board-level reporting
Frequently asked questions
What providers ask most about MirusPlus Business Intelligence & AI, from dashboards and reports to alerts and Power BI.
Business Intelligence & AI is the MirusPlus module for dashboards, reports and performance alerts across your operation. It draws on data from every MirusPlus module, so clinical, workforce, financial and governance performance is visible in one place. You can filter by home, wing or organisation, and export for board packs and executive reporting.
Manual reporting takes time when data has to be pulled from separate systems and rebuilt in spreadsheets. MirusPlus includes around 300 pre-built reports across clinical, workforce, financial and governance areas, ready to run, preview and print. Quality indicator reports mirror the NQIP portal, so quarterly submissions become a download-and-submit task.
Yes. Every list view in MirusPlus includes pivot grids and timeline charts, so you can chart any field by any other, such as incidents by department, audit results by standard or falls by wing by month. You can filter by date range and export to Excel for board meetings. The same charting works everywhere, so staff learn it once.
MirusPlus raises automated alerts when variances, risks or KPI thresholds are breached, such as five complaints in a week, falls above baseline or an unfavourable shift in AN-ACC funding mix. Leaders see issues early and can act before performance or compliance is affected.
Yes. MirusPlus integrates with Microsoft Power BI, so you can build custom dashboards and reports on live platform data. For other business intelligence systems, Data-as-a-Service gives secure access to structured, validated MirusPlus datasets, with governance, data quality and access control kept in place.
MirusPlus Business Intelligence & AI reports on your day-to-day operation using the data in MirusPlus, through dashboards, reports and alerts. Mirus Metrics turns a provider’s data into decisions on funding, compliance and risk, bringing disconnected data together in one connected view so leaders can act before the quarter closes.