Mirus Industry Analysis March 2019 (MIA)
April 14, 2019 | Mirus Industry Analysis (MIA)

Mirus Industry Analysis or MIA is our monthly video + blog series that brings to you all figures and statistics related to the industry. This month started with the ACAR announcement of 13500 new beds to the industry and the general medicare funding boost announcement of $320 million to residential aged care industry.
ADS & Occupancy
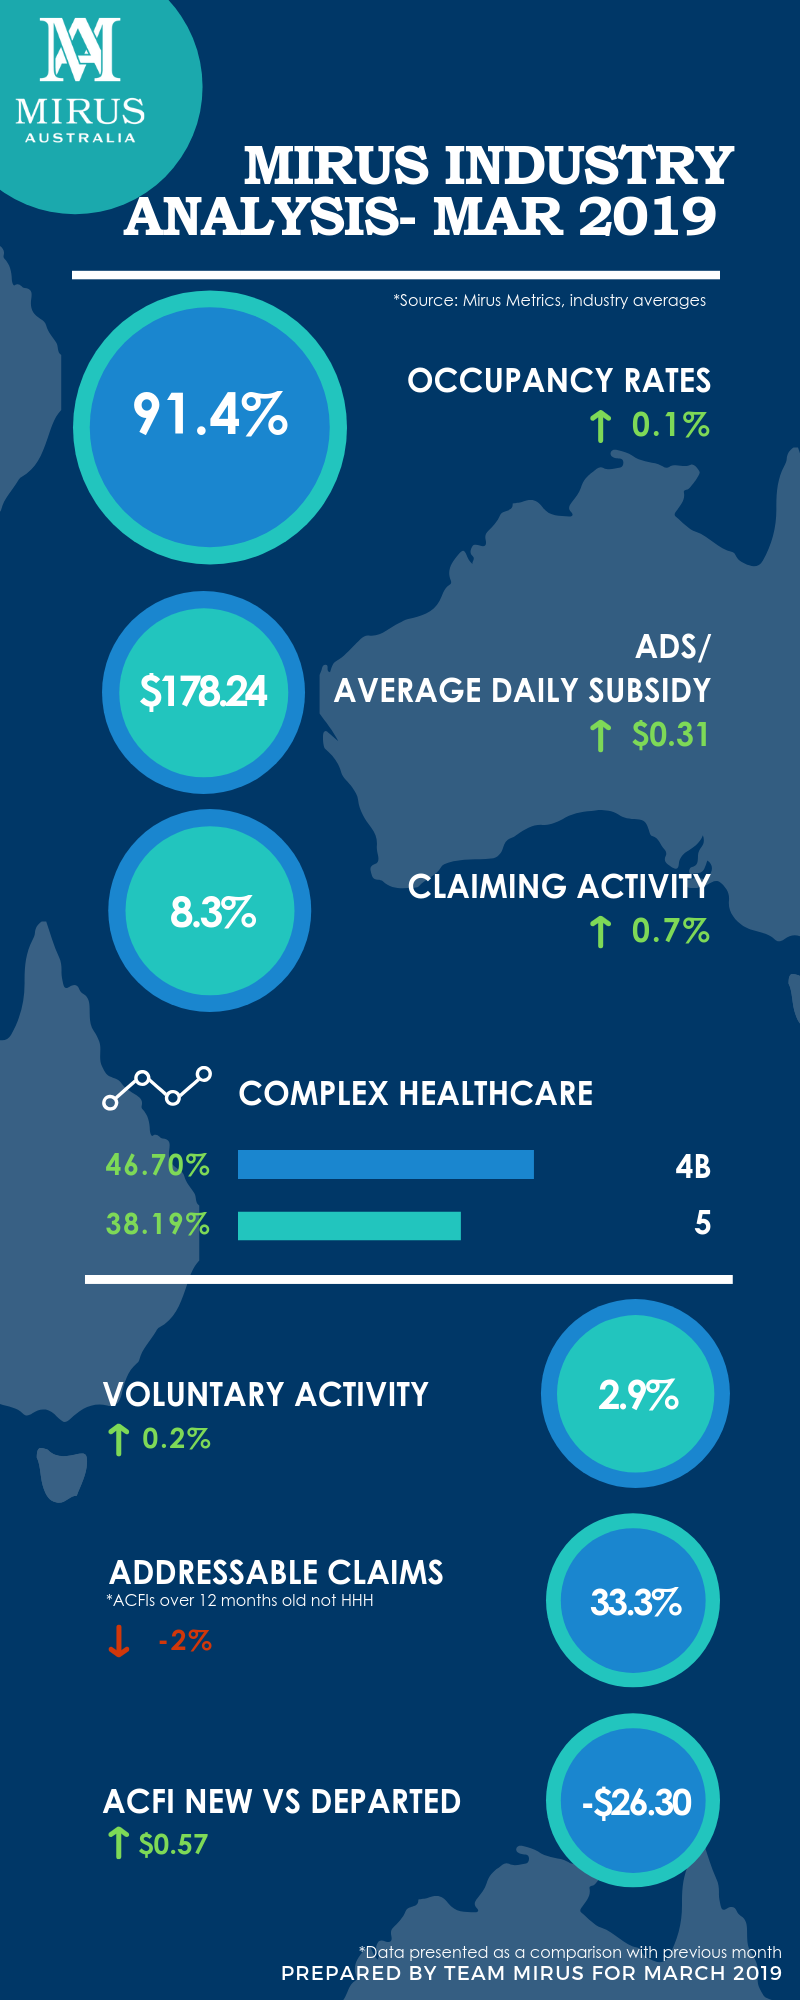
The Average Daily Subsidy was up across the industry at $178; with the private operators leading at $188 and not-for-profits at $173. Occupancy also saw strong results, with the not-for-profits at 93%, the private operators at 89% and the industry average is at 91.4%.
(To read out latest blog on CRM click here. To order a custom made accommodation pricing report for your facility that helps you in bench-marking your value with your competition, please click here.)
Claiming Activity
There was an upward trend in claiming activities in March 2019, following the surge in ADS and Occupancy throughout the industry. The industry average is at 8.3% now with the private operators at a claiming activity of 10% an increase of 1.1%. They are leading when compared to the not-for-profits who are currently only at 7.7% activity.
Voluntary Claims
The voluntary claiming activity or proactive claiming was recorded the same for all segments of the industry at 2.9%. The not-for-profits have held steady since February and the private operators have slightly increased their voluntary activities to 3.4%.
Addressable Claims
The overall percentage of addressable ACFI Claims (older than 12 months not HHH indicating they are eligible for voluntary claiming), retreated in all 3 segments, with the industry average went down from 35.3% to 33.3%. The not-for-profits are at 36.6% while the private operators are at 25.4%. We’ve linked this decline with the increase in occupancy for the period and the number of discharges in this period & the subsequent ACFI transitions.
Variance: New Vs Departed ACFI
When we look at the average ACFI of new residents compared to departed, we calculate the variance of the ADS between these two segments. With growing occupancy numbers, we are noticing a widening of the variance, the industry average variance now at $26.30. The private operators grew the most here at $22.51 per day whereas for the not-for-profits, it is at $27.89. For a benchmark level, the Mirus ACFI experts suggest a variance of $20 per day to be maintained as a good performance indicator for your facility. If you’d like to read more on ACFI optimisation, click here.
Complex Health Care Domain
Within the complex health care domain, we’ve seen a steady increase in the 4B procedures. The private operators are at 50% of all claims having a 4B claim attached to it within the medicare data.
Workforce Trends
There were declining trends in both care and non-care hours during March 2019. Non-care hours were down by 3.6% and the care related hours were by 1.2%. If we unpack the care related hours, the RN hours had a positive jump of 1% and EN hours by 10%. The AIN hours declined by 1% and the Allied Health hours also saw a drop of 5%. The biggest drop was seen in agency hours at 18%.
With the growing trend of increasing occupancy throughout the industry, we urge providers to have a look at their CRM to see if it’s working for them. Please use our CRM Self Diagnosis Tool for the same.
If you would like to get in touch with us please do so here.
Drop in a topic request for our blogs here.
See you next month!
-Team Mirus