Mirus Industry Analysis February 2019 (MIA)
March 8, 2019 | Mirus Industry Analysis (MIA)
Mirus Industry Analysis or MIA is our monthly video + blog series that brings to you all figures and statistics related to the industry. This month started with the ACAR announcement of 13500 new beds to the industry and the general Medicare funding boost announcement of $320 million to residential aged care industry.
ADS & Occupancy
The Average Daily Subsidy was up across the industry at $178.34; with the private operators leading at $188 and not-for-profits at $174. Occupancy also saw an upward trend across the industry in February 2019 compared to January.. For the not-for-profits, it is at 92.9%, the private operators held steady at 88.9% and the industry average is at 91.2%.
(To learn more about Mirus CRM that empowers your occupancy strategy powered by Salesforce please click here. To order a custom made accommodation pricing report for your facility that helps you in bench-marking your value with your competition, please click here.)
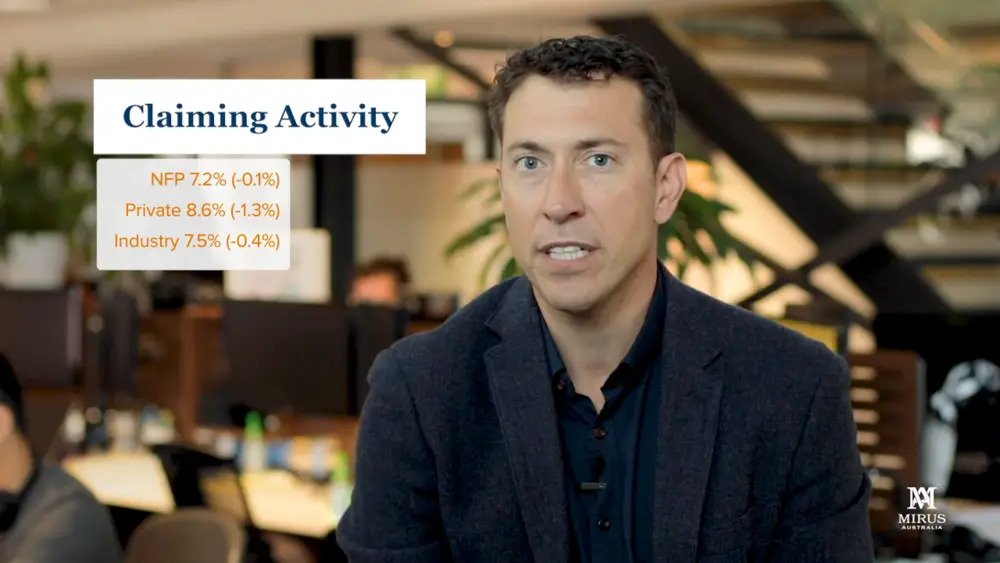
Claiming Activity
Overall ACFI activities dipped in February 2019, including both voluntary and mandatory claims, across all sectors. The industry average is was at 7.5% now with the private operators at a claiming activity of 8.6% suffered a dip by 1.3%. They are leading when compared to the not-for-profits who are currently only at 7.2% activity.
Voluntary Claims
The voluntary claiming activity or proactive claiming was recorded the same for all segments of the industry at 2.7%. The private operators have dipped slightly by 0.2% here.
Addressable Claims
The overall percentage of addressable ACFI Claims (older than 12 months not HHH indicating they are eligible for voluntary claiming), increased to 35.3%. The not-for-profits are at 38.6% while the private operators are at 27.2%.
Variance: New Vs Departed ACFI
When we look at the average ACFI of new residents compared to departed, we calculate the variance of the ADS between these two segments. The industry average variance between new versus departed ACFI is at $25.68. This figure is tighter and looks better for the private operators at $21.26 whereas for the not-for-profits, it is at $27.52. For a benchmark level, the Mirus ACFI experts suggest a variance of $20 to be maintained as a good performance indicator for your facility. If you’d like to read more on ACFI optimisation, click here.
Complex Health Care Domain
Within the question 12 and the complex healthcare domain, we’ve seen the 4B and pain management claims continuing to grow across the industry at 46.7%. The private operators are leading at 49.35%% and the not-for-profits are not too far behind at 45.49%.
Workforce Trends
There were mixed trends in workforce during February 2019. Non-care hours increased by 2.88%(0.83 hours) & care-hours per bed per day also increased by 0.38% (2.42 hours) compared to January. We did unpack the care-hours, to see that the RN hours increased by 0.85% and the agency hours significantly grew by 21%.
If you would like to get in touch with us please do so here.
Drop in a topic request for our blogs here.
See you next month!
-Team Mirus