Mirus Industry Analysis (MIA) March 2021
April 9, 2021 | Mirus Industry Analysis (MIA)

Rob Covino presents Mirus Industry Analysis (MIA), insights into the previous month’s key performance indicators across the not-for-profit, private providers, and the cumulative industry trends from the 89,000+ beds the Mirus Australia team currently monitors for financial sustainability.
72% of providers are operating at a loss
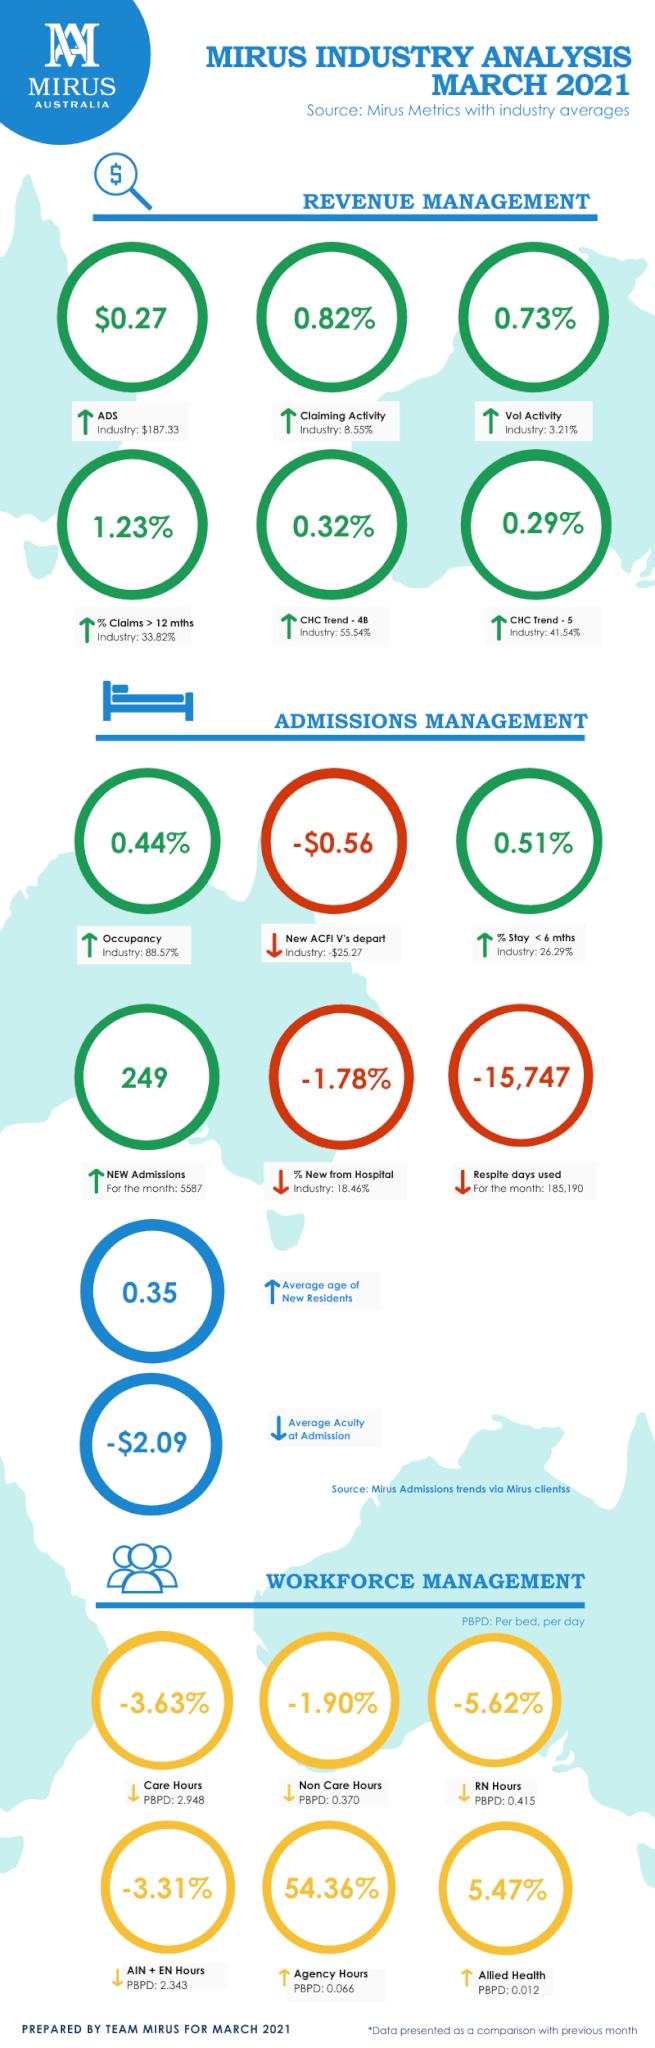
Revenue management
The required daily funding improvement to sustain financial sustainability at $12 a per resident. Just as we were becoming comfortable with regular reporting of zero community cases, our existence with the COVID-19 Pandemic is still far from over. The competing priorities we have to manage across our industry will unfortunately be with us for some time. And with that, as reported by Stewart Brown, 72% of providers are operating at a loss.
Admissions management
With the rising capital within the communities we service as residential providers, our capital strategies should be considered in context to the individual localities we operate. Demand for places is increasing, with occupancy levels rebounding across most providers.
Workforce management
The recommendations from the Final Royal Commission Report suggest that staffing levels and skill mixes are mostly unregulated across our industry. Both commissioners recommended that aged care meet a minimum staff time and quality safety standard for registered nurses, EN and personal care workers to bring the sector to a four-star minimum rating in two stages.
Quality, risk and compliance management
March saw the lowest level of non- compliances issued over the last 12 months, with only 2 non-compliances being issued across the industry. Most of the non-compliance activity related to Standard 3 – Personal Care and Clinical Care, with both Standard 7 – Human Resources and Standard 8 – Organisation Governance, each scoring 2 events of non-compliance in the month. However, the overall results were a significant improvement from the previous month.
Get insights for your own organisation against the industry data
Benchmarking & Insights allow you to compare your Average Daily Subsidy (ADS) to the industry average. You will also gain valuable insights into your ACFI/AN-ACC claiming activity and benchmarking to support your occupancy, revenue, and workforce strategies. What’s even better, is that it’s free.
Click here to benchmark your facility today.
About Mirus Industry Analysis (MIA)
We love numbers and we love data! With one of the largest Aged Care databases in Australia, each month we bring you MIA – a monthly wrap up of insights captured from data covering 89,000+ beds.
Please contact us if you have any questions about this edition.
Further resources:
- Consumer choice is here. And to be competitive you need to understand your market. Click here for the Accommodation Pricing Report
- ACFI Advanced Course (online) available for April – to book now or for more information
- The Trust Series with Tom Murphy, Head of Workforce
- Have you missed anything? Workforce Diagnostic with the Mirus Team
- Improve occupancy and sales revenue. Check out the Sales & Marketing Diagnostic with the Mirus Team
Thanks and see you next month!
Rob Covino + the Mirus Australia Team