Mirus Industry Analysis (MIA) – November 2022 edition
November 28, 2022 | Aged Care Finance

Rob Covino presents Mirus Industry Analysis (MIA), a series of monthly insights into the key performance indicators and cumulative industry trends from the 90,000+ beds we monitor for financial sustainability.
Hello and welcome to Mirus Industry Analysis, November edition, this month we bring it to you as a blog.
Well, our first month of AN-ACC has come and gone and as of the 17th of November, only a third of the industry has been able to finalise the October claim period so we are still receiving new data from payment finalisations being completed by Services Australia.
Despite having a smaller data set of finalised October claims in Medicare, we still have six-plus weeks of AN-ACC classifications and events to analyse, which gives us visibility to report on for the sector.
We have many insights based on the performance measures we are familiar with under ACFI, but we will need to include many new metrics which the Government Reforms and AN-ACC has brought to the industry.
The new metrics and performance measures from AN-ACC
One example of the new measures is how we report Average Daily Subsidy (ADS). Historically we excluded Respite residents from our calculations of ADS, but now Respite residents, just as permanent ones, have a care minute requirement associated with their classification. Therefore, this cohort will become an important consideration in the overall operating result and tracking for both funding and care minute compliance. We have always removed default resident payments as that rate is a holding rate until an AN-ACC classification has been assigned and will then be retroactively applied to the date of admission or the date in which MyAgedCare received the reclassification request from the Service.
Beyond Respite, we now must also consider the effect each facility type (as determined under AN-ACC) will have on an industry average. There is a significant group of beds that qualify to receive the Homeless Base Care Tariff, who now have an ADS of $300/day.
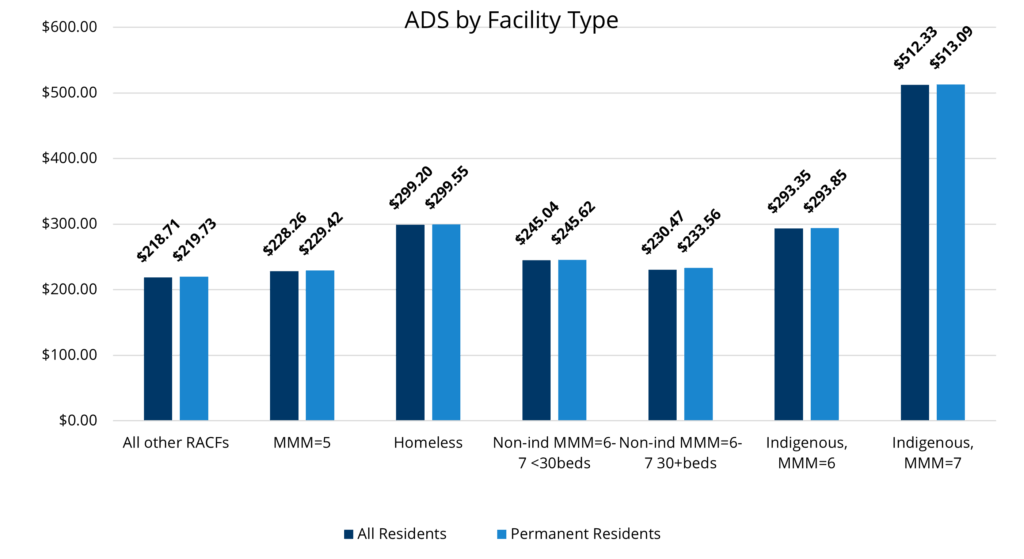
The facilities in Modified Monash 6 and 7 are an admittedly small group but ADS of over $513 for even a small group is enough to move the industry average. So we will need to report ADS by Facility Type as well as by the overall industry.
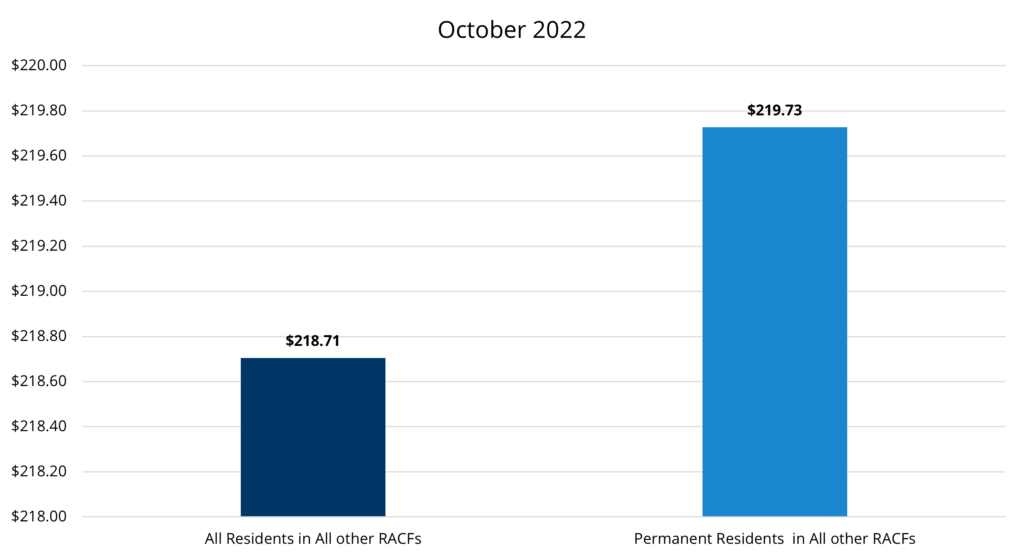
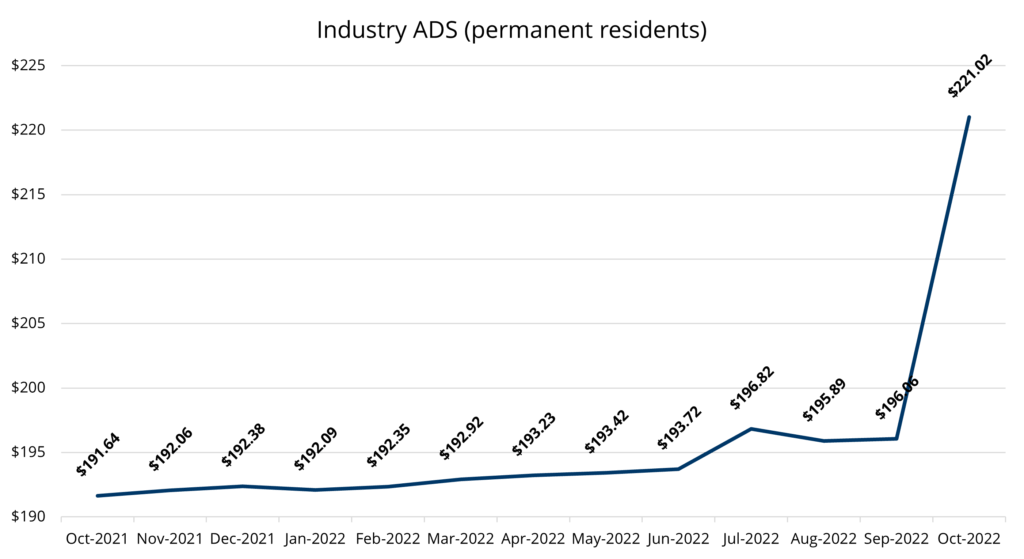
The Industry’s ADS for permanent & respite residents increased by $24.92 in October 2022 to $219.98 (12.78%). The average for all residents is $218.71.
The Department of Health’s predicted $225 Average Daily Subsidy, which derived the widely discussed 200 Care Minute requirement average, fell short by $4/day.
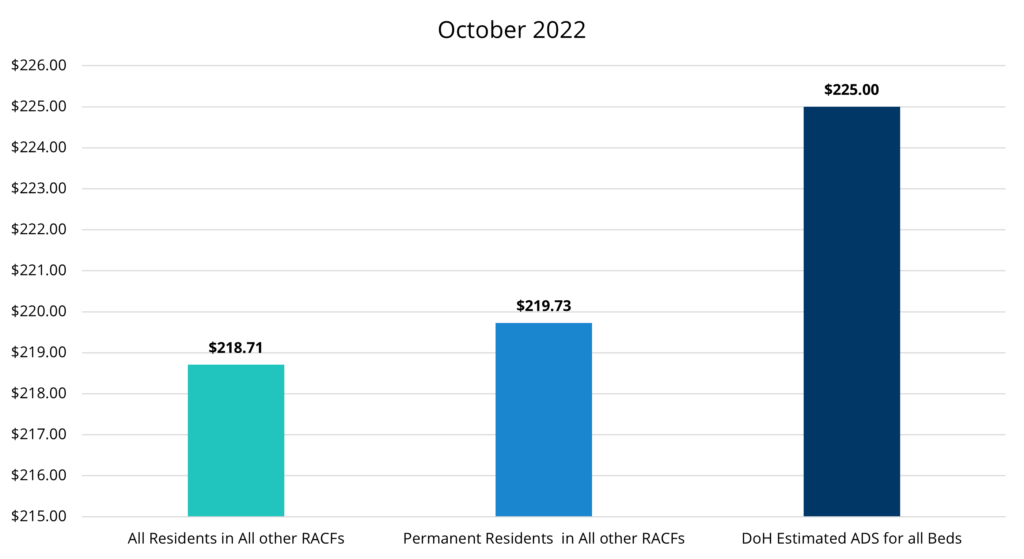
And looking at all residents in All other RACFs we see and ADS of $218.71, which is obviously well over $6 less than $225.
The funding model changeover to AN-ACC can take providers up to 5 years to transition
With the previous introductions of funding instruments to our sector, history has shown there is a 3–5-year period for a Provider’s operational teams, systems, and processes to apply the new model within their services. Those Providers who can accelerate that curve will be better off.
As AN-ACC is an algorithm which assigns a funding class through the inputs applied by a contracted Assessment Management Organisation (AMO), the initial challenge for Providers will be understanding how AN-ACC is applied so that Providers can accurately forecast classes on consumers who are in care as they await their results, as well as challenge outcomes which they do not agree with the concluded outcome from this process.
This is further complicated by the timing delay or latency which providers will have to wait until they are assigned a class outcome on default rate residents, or consumers who are awaiting a reclassification outcome.
Accurately forecasting class outcomes will be important so that providers can also monitor their care minute requirement with every assigned funding class as well as account for the impact new admissions and discharges will have on their income and care minute obligations.
Effectively, this means that top line income is no longer the key outcome for success as it was under ACFI. If you cannot sustain the level of staffing required by your assigned case mix for the income you are receiving, then you will be paying more per minute of care in the form of penalty rates, overtime, and agency to meet your care minute requirements. Therefore, under AN-ACC, sustainable and compliant operations will be the key to success.
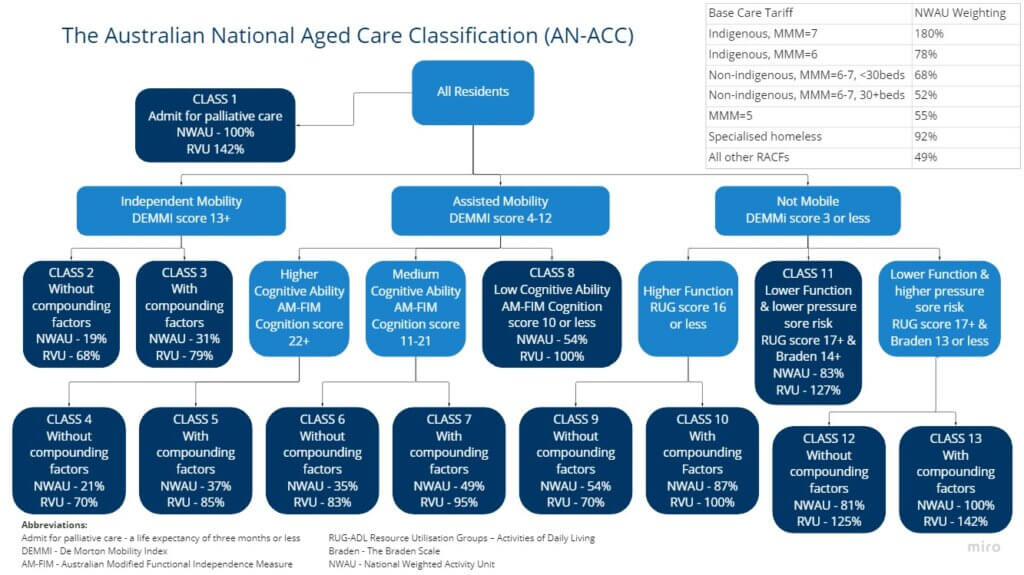
AN-ACC overview of classes
The AN-ACC Class distribution for the sector shows the most frequent outcome is Class 5 (Assisted mobility with high cognitive function and compounding factors).
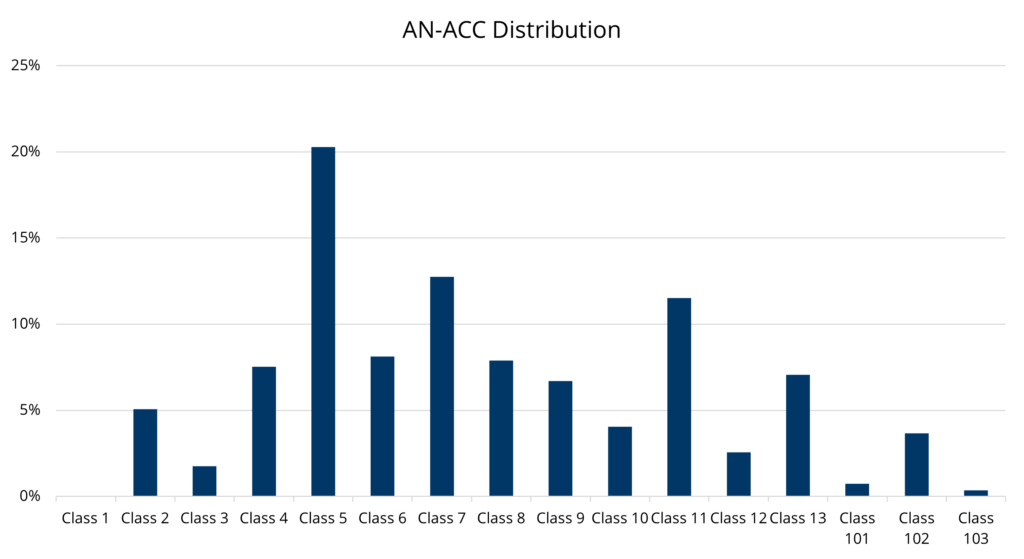
With the next most common being Class 7 which is the same resident but with Medium Cognitive function.
Workforce: Care minute industry average is lower than targeted 200 mins average
With the lower ADS, the refined RVU weighting based on an estimated $225 ADS have caused the industry average case mix to be lower than the targeted 200 required average. The average for all residents in care today is 196 minutes per bed day.

Insight predicting the allowable operating margin:
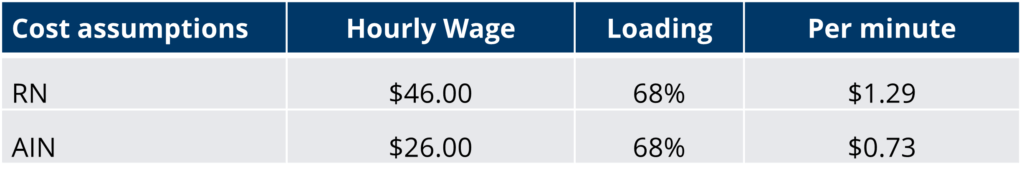
Looking at standard industry award pay rates and including the 15% that will be added based on the Fair Work case results, we can compare the current AN-ACC claims to the estimated cost to resource the required AIN and RN minutes.
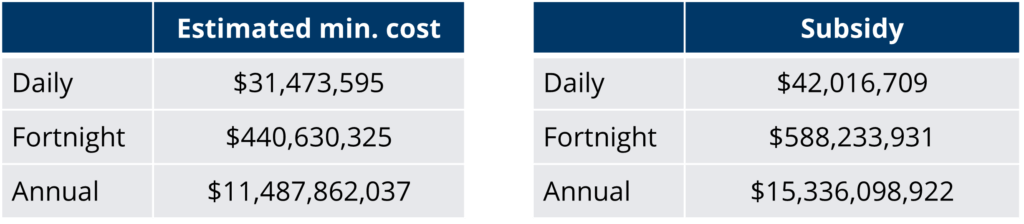
Now with the annual forecasted Government expenditure on AN-ACC to be around $15.3 billion, which is close to what was budgeted. The cost in resourcing 157 AIN minutes and 39 RN minutes is around $11.5 billion, which results in an operating result of 75%, which is the figure DoHAC has been quoting recently as the margin available to providers to operate with.
And lastly, we have now launched our upgraded Mirus Metrics to support AN-ACC. Thank you to all the Beta testing clients and for your ongoing support and feedback. If you’d like to learn more, please visit https://www.mirusaustralia.com/mirus-metrics
We look forward to bringing a fresh look at this data in our regular video blog format next month.
As a MIA subscriber you will have access to the full data set
breakdown as a downloadable PDF
Get insights for your own organisation against the industry data
Benchmarking & Insights allow you to compare your Average Daily Subsidy (ADS) to the industry average. You will also gain valuable insights into your ACFI/AN-ACC claiming activity and benchmarking to support your occupancy, revenue, and workforce strategies. What’s even better, is that it’s free.
Click here to benchmark your facility today
About Mirus Industry Analysis (MIA)
We love numbers and we love data! With one of the largest Aged Care databases in Australia, each month we bring you MIA – a monthly wrap up of insights captured from data covering 90,000+ beds.