Mirus Industry Analysis November 2019
December 12, 2019 | Mirus Industry Analysis (MIA)
Mirus Industry Analysis or MIA is our monthly series that brings to you all figures and statistics related to the industry. For all support queries please contact our team here. Rob mentions the complimentary benchmarking reporting we offer, if you would like to join 72K bed licences that we currently monitor, please click here.
ADS & Occupancy
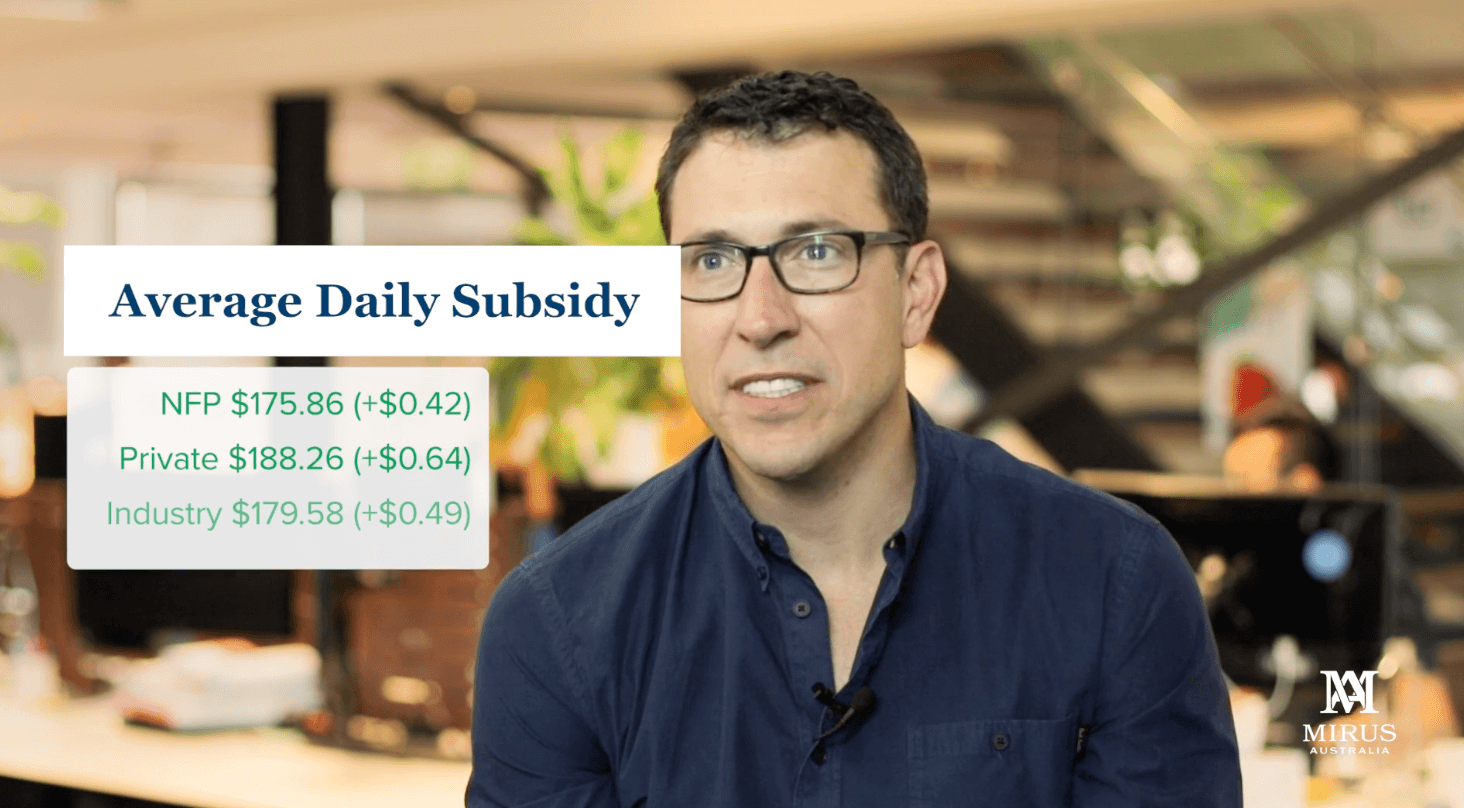
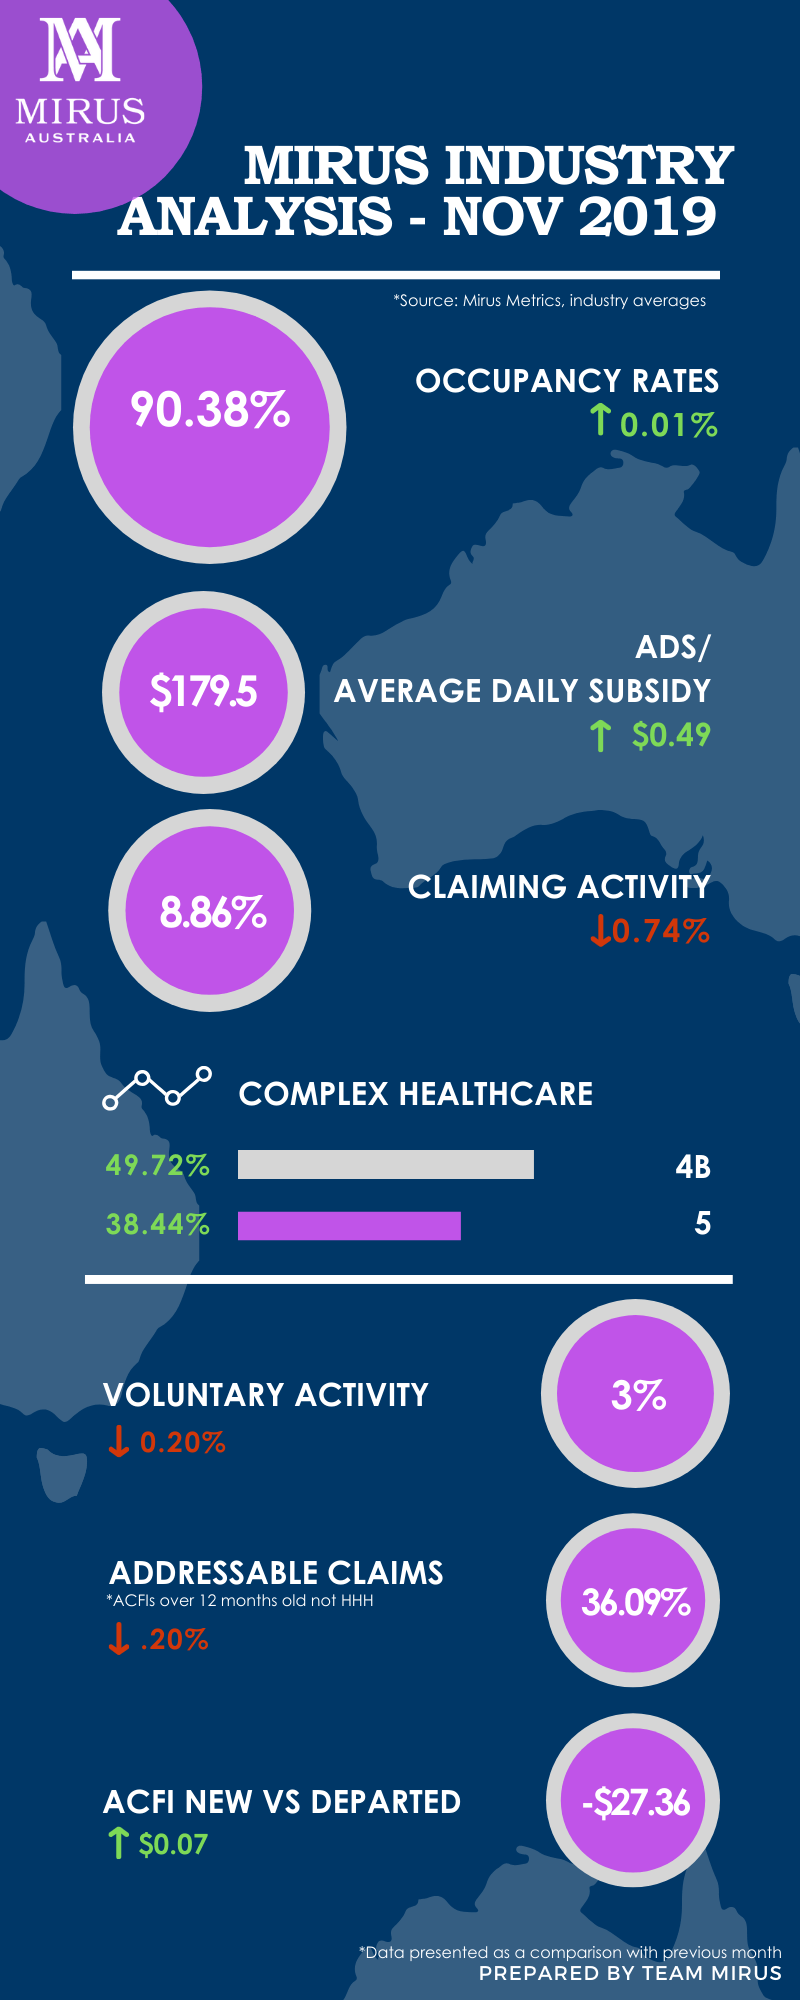
The Average Daily Subsidy was up across all three cohorts with the industry at $179.58; with the private operators are at an all time high at $188.26 and not-for-profits at $175.86. Whereas Occupancy had a relatively mixed result across the 3 segments, with the not-for-profits down at 90.38%, the private operators up at 88.96% and the industry average is at 91.02%.
Consumer acquisition strategies and having the right information at the right time through an efficient CRM tool is key to maintaining your Occupancy.
(To check if your CRM is working for you and to improve your Admissions Process & Occupancy please visit our CRM Self-diagnosis tool.)
Claiming Activity
Overall Medicare claiming activities in November 2019 was down across all 3 cohorts. The industry average 8.86% with the private operators at a claiming activity of 10.23% (+1.18%). The not-for-profits are currently at 8.35% (A decrease of 0.59%).
(If you are looking for consistency between clinical documentation and supportive evidence for ACFI claiming, please visit Mirus CASE from our ACFI team, to quickly produce high quality assessments, care plans and funding claims.)
MIA November 2019 infographic
Voluntary Claims
The voluntary claiming activity or proactive claiming was down across all 3 cohorts, the industry average being 3.13%. The private operators are at 3.30% (decrease by 0.32%) and the not-for-profits are at 3.06% (decreased by 0.02%). This is a good measure of productivity and an indicator that can drive the ADS upwards.
Addressable Claims
The overall percentage of addressable ACFI Claims (older than 12 months not HHH indicating they are eligible for voluntary claiming), was up across all 3 segments, with the industry average at 36.45% (+1.66%). The not-for-profits went up to 39.17% and the private operators went up to 29.79%. The private operators as can be seen have a faster and more aggressive process around this.
Variance: New Vs Departed ACFI
When we look at the average ACFI of new residents compared to departed, we calculate the variance of the ADS between these two segments. The industry average variance now at $27.61, with the private operators are leading at $24.84 and the not-for-profits are at $28.71.
For a benchmark level, the Mirus ACFI experts suggest a variance of $20 per day to be maintained as a good performance indicator for your facility. If you’d like to read more on ACFI optimisation, click here.
Complex Health Care Domain
Within the complex health care domain, we’ve seen a steady increase in the 4B procedures, with the industry average at 49.51% which also correlates to some of the strategies used by the industry to push the ADS up. The private operators are at 52.11% of all claims having a 4B claim attached to it within the medicare data, whereas the not-for-profits are at 48.39%. The continence 5 claims also increased, with the industry average at 38.59%. The private operators are at 44.08% and the not-for-profits are at 36.04% here.
Workforce Trends
The workforce trends in both care and non-care hours during October 2019 was positive. Non-care hours were down by 1.06% (0.84 hours) and the care related hours grew by .64% (2.41 hours). If we unpack the care related hours, the agency hours went up by 12.06% (0.07 hours), the AIN hours was up by .35% (1.70 hours) and the Allied Health hours down 65.32% (0.02 hours). The RN hours increased by 1.14% or 0.57 hours and EN hours down by 7.65% or 0.01 hours per bed per day basis.
With the significant amount of changes happening in the industry, we urge providers to have a look at their CRM & see if it’s working for them. Please use our CRM Self Diagnosis Tool for the same.
If you would like to get in touch with us please do so here.
Drop in a topic request for our blogs here.
See you next month!
-Team Mirus