Mirus Industry Analysis – August 2019
September 11, 2019 | Mirus Industry Analysis (MIA)

Mirus Industry Analysis or MIA is our monthly video + blog series that brings to you all figures and statistics related to the industry. Natanya Full, Product Manager of Mirus Admissions Companion joins Rob Covino in this episode to discuss Admissions Management. Click here to download Mirus Australia’s answer to each of the 8 new Aged Care Quality Standards.
For all support queries please contact our team here.
ADS & Occupancy
The Average Daily Subsidy was brought up to a new high across industry at $180.14; with the private operators are at an all time high at $188.65 and not-for-profits at $176.33. Whereas Occupancy had a mixed movement across on all 3 segments, with the not-for-profits down at 90.90%, the private operators up at 88.33% and the industry average down to 90.08%.
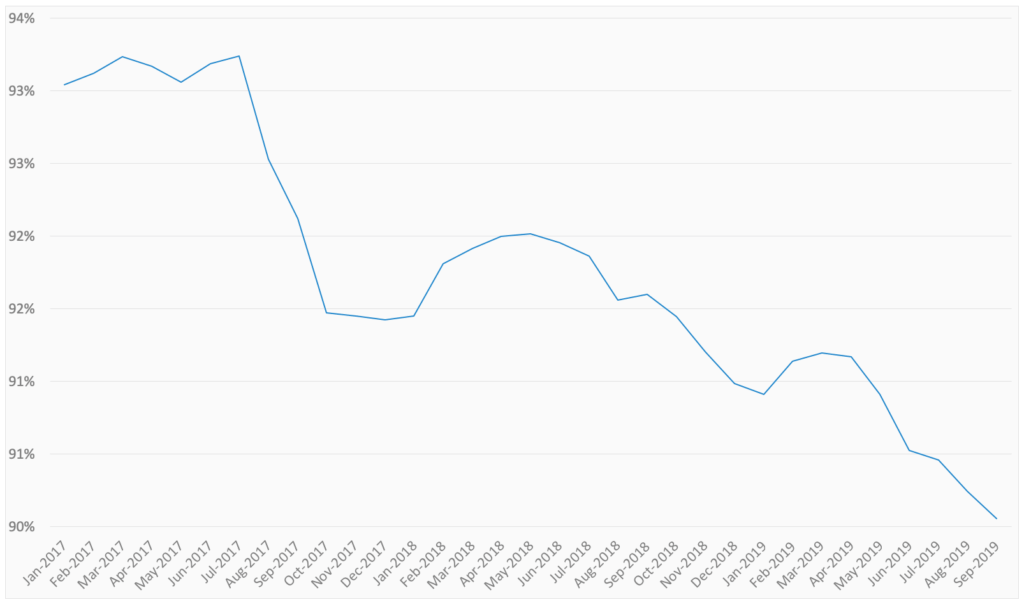 Occupancy trends across the industry from January 2017 to August 2019
(To check if your CRM is working for you and to improve your Admissions Process & Occupancy please visit our CRM Self-diagnosis tool.)
Claiming Activity
There was a mixed trend in the Medicare claiming activities in August 2019. The industry average improved to 8.76% (a growth of 0.31%) with the private operators at a claiming activity of 9.74% (a decrease of 0.43%). They are leading when compared to the not-for-profits who are currently at 8.38% (A growth of 0.58%).
(If you are looking for consistency between clinical documentation and supportive evidence for ACFI claiming, please visit Mirus CASE to quickly product high quality assessments, care plans and funding claims.)
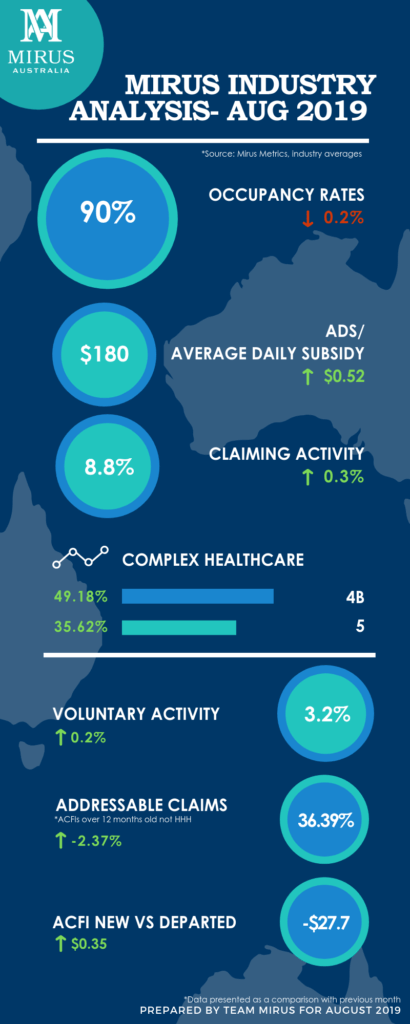 MIA August 2019 infographic
Voluntary Claims
The voluntary claiming activity or proactive claiming was up across all 3 cohorts, the industry average being 3.25%. The private operators are at 4.56% (an increase of 0.22%) and the not-for-profits are at 3.13% (an increase of 0.2%). This is a good measure of productivity and an indicator that can drive the ADS upwards.
Addressable Claims
The overall percentage of addressable ACFI Claims (older than 12 months not HHH indicating they are eligible for voluntary claiming), was up in all 3 segments, with the industry average went up to 36.39%. The not-for-profits went up to 39% while the private operators went up to 30.09%. The private operators as can be seen have a faster and more aggressive process around this.
Variance: New Vs Departed ACFI
When we look at the average ACFI of new residents compared to departed, we calculate the variance of the ADS between these two segments. With the declining occupancy numbers, we are noticing a widening of the variance, the industry average variance now at $27.73. The private operators are leading at $23.81 and the not-for-profits are at $29.35.
For a benchmark level, the Mirus ACFI experts suggest a variance of $20 per day to be maintained as a good performance indicator for your facility. If you’d like to read more on ACFI optimisation, click here.
Complex Health Care Domain
Within the complex health care domain, we’ve seen a steady increase in the 4B procedures, with the industry average is at 49.18% which also correlates to some of the strategies used by the industry to push the ADS up. The private operators are at 51.62% of all claims having a 4B claim attached to it within the medicare data, whereas the not-for-profits are at 48.09%. The continence 5 claims also increased, with the industry average at 38.47%. The private operators are at 45% and the not-for-profits are at 35.62% here.
Workforce Trends
There were declining trends in both care and non-care hours during August 2019. Non-care hours were down by 1.24% (0.84 hours) and the care related hours decreased by 0.53% (2.45 hours). If we unpack the care related hours, the agency hours had a decrease of 2.36% (0.04 hours), the AIN hours declined by 0.65% (1.69 hours) and the Allied Health hours grew by 10% (0.03 hours). The RN hours declined by 1% or 0.61 hours and EN hours increased by 19% or 0.01 hours per bed per day basis.
Natanya Full joins Rob in this month’s MIA, to discuss Admissions Management. Connect with Natanya on LinkedIn here.
With the decline of occupancy throughout the industry, we urge providers to have a look at their CRM & see if it’s working for them. Please use our CRM Self Diagnosis Tool for the same.
If you would like to get in touch with us please do so here.
Drop in a topic request for our blogs here.
See you next month!
-Team Mirus