Mirus Industry Analysis (MIA) May 2021
June 22, 2021 | Aged Care Management

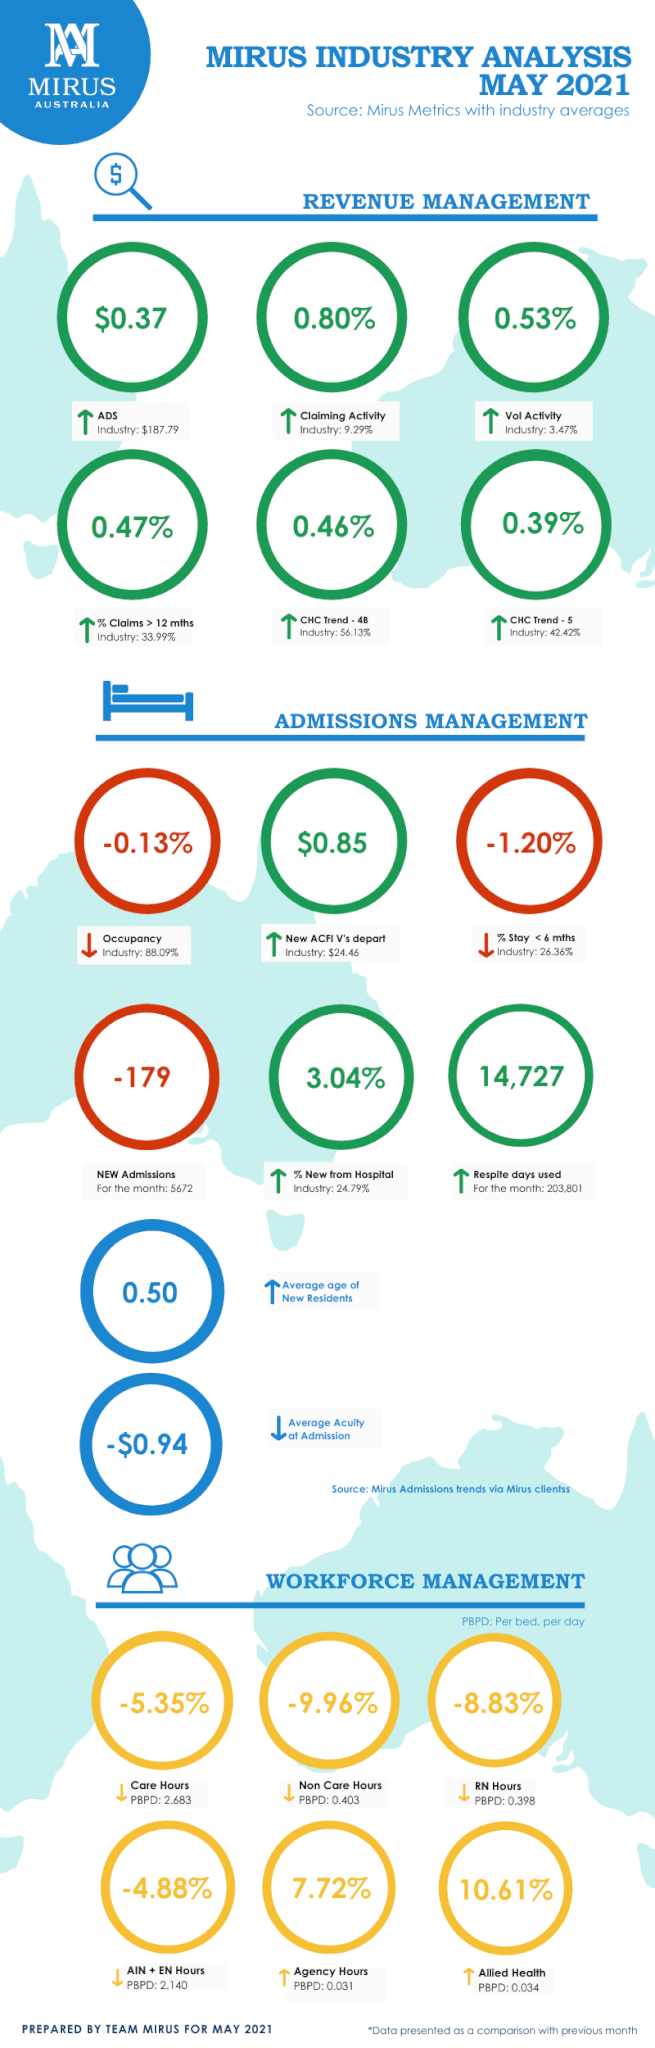
Occupancy levels are low at 88%
Rob Covino presents Mirus Industry Analysis (MIA), insights into the previous month’s key performance indicators across the not-for-profit, private providers, and the cumulative industry trends from the 89,000+ beds the Mirus Australia team currently monitors for financial sustainability
Revenue management
May saw continued growth in overall industry Average Daily Subsidy (ADS), jumping to up to $187.79, with the Private operators reaching $195 ADS. The overall movements in ADS came from the strong claiming activity rates, especially led by the jump in the voluntary claiming rates by the private providers of 3.71% of total claims being submitted in the month of May alone.
Admissions management
The industry was largely flat on their overall occupancy levels, at which saw a slight decline to 88.09%. The not-for-profit providers saw an 8% increase in new admissions from hospitals compared to the previous month, resting at just over 30%. Furthermore, the not-for-profits seemed to favour the respite entry status to boost their new permanent entries, as a further 9000 beds were used than the previous month. The average age of consumers entering care jumped to just over 85 years of age, with private operators at 88 years of age at entry.
Workforce management
Registered nurse (RN) minutes declined throughout May, however as providers continue to leverage their pain management claiming to support overall subsidy growth, we did see a rise in overall allied health time per resident.
Quality, risk, and compliance
We are continuing to see providers balance the overall level of compliance across their services as the Aged Care Quality and Safety Commission moves to mobilise a further 1500 unannounced site audits this coming year.
ACFI & AN-ACC calculator
We’ve launched the ACFI & AN-ACC calculator to help providers get an early start on how to familiarise themselves with what is coming with the October 2022 AN-ACC transition and to better understand any differences in entitlements under the new AN-ACC model.
The calculator will enable providers to estimate case mix outcomes associated with their present ACFI claims, as well as model individual scenarios based on their current ACFI assessments.
Users can put in ACFI and AN-ACC details for residents, including their activities of daily living, behaviours and complex health care scores, and receive an AN-ACC estimate alongside the ACFI rates.
Try the ACFI & AN-ACC calculator today and visit our dedicated AN-ACC Resource Hub for further resources.
Get insights for your own organisation against the industry data
Benchmarking & Insights allow you to compare your Average Daily Subsidy (ADS) to the industry average. You will also gain valuable insights into your ACFI/AN-ACC claiming activity and benchmarking to support your occupancy, revenue, and workforce strategies. What’s even better, is that it’s free.
Click here to benchmark your facility today.
About Mirus Industry Analysis (MIA)
We love numbers and we love data! With one of the largest Aged Care databases in Australia, each month we bring you MIA – a monthly wrap up of insights captured from data covering 89,000+ beds.
Further resources:
- Check out the Mirus ACFI & AN-ACC calculator, the first step in building technology to help you manage AN-ACC.
- Consumer choice is here. And to be competitive you need to understand your market. Click here for the Accommodation Pricing Report
- ACFI Advanced Course (online) available – to book now or for more information
- The Trust Series with Tom Murphy, Head of Workforce
- Have you missed anything? Workforce Diagnostic with the Mirus Team
Thanks and see you next month!
Rob Covino + the Mirus Australia Team