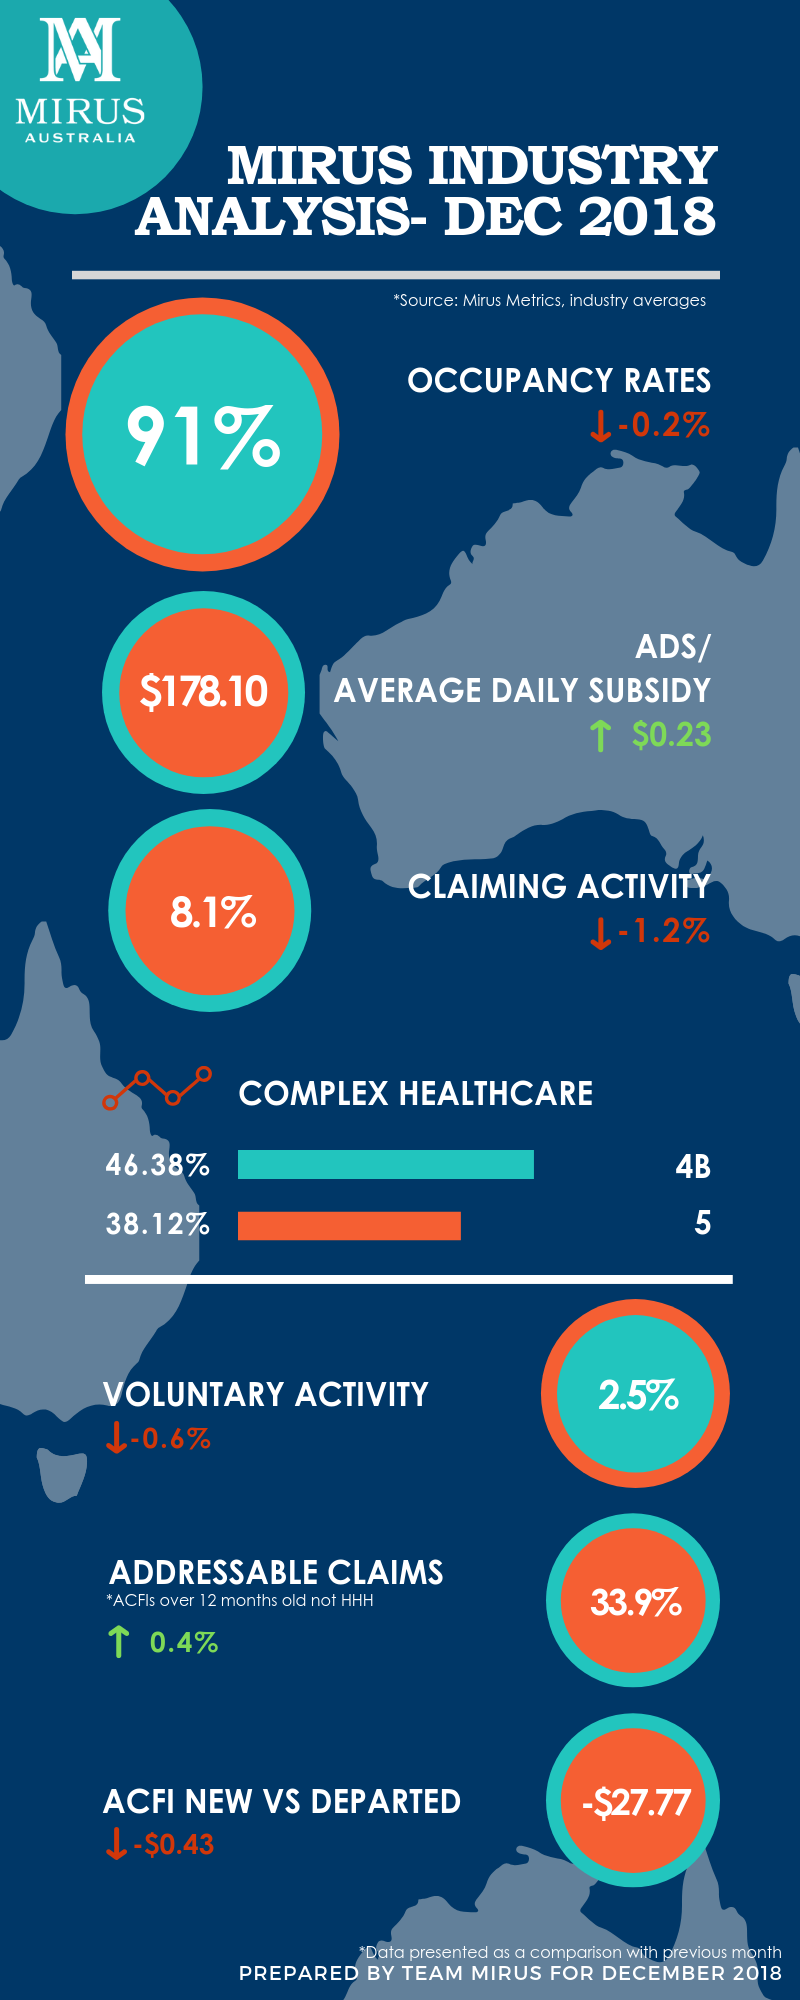
Mirus Industry Analysis December 2018 (MIA)
January 24, 2019 | Aged Care Finance
We understand that KPIs and performance levels need to be measured continuously as care requirements of your clients and your activities to keep up with it changes in real-time. To hopefully make things a little easier for you, every month, we’ll be bringing to your table ‘Mirus Industry Analysis’ or MIA via our aged care blog. In case you prefer watching videos, please head over to this link.
ADS & Occupancy
The Average Daily Subsidy was up across the industry (including both not-for-profits and for-profits) at $178.10. Occupancy continues to see downward pressure across the industry from the last six months. For the not-for-profits, it is at 92.9%, the private operators are at 88.9% and the industry average is at 91.2%.
(To learn more about Mirus Admissions Companion powered by Salesforce to assist you with customer relationship management, please click here.)
Claiming Activity
Overall ACFI activities were also seen to be low in December 2018, including both voluntary and mandatory claims, across all sectors. The industry average which was at 9.1% in November has dropped down to 8.1%. The private operators at a claiming activity of 9.5% had a drop of 1.9% activity from November. However, they are still leading when compared to the not-for-profits who are currently only at 7.5% activity.
Voluntary Claims
The voluntary claims submitted across the industry is at 2.5% and has gone down from 3.2% in November 2018. When split up between different segments, the private operators are leading here as well at 2.8% compared to the not-for-profits at 2.4%.
Addressable Claims
With the overall percentage of addressable ACFI Claims (greater than 12 months, not HHH), there was a slight increase; which reflects the overall dip in claiming activities. The industry is at 33.9% and here the private operators have only 25.6% of their claims that are addressable whereas the not-for-profits are at 37.1%, well above the industry average.
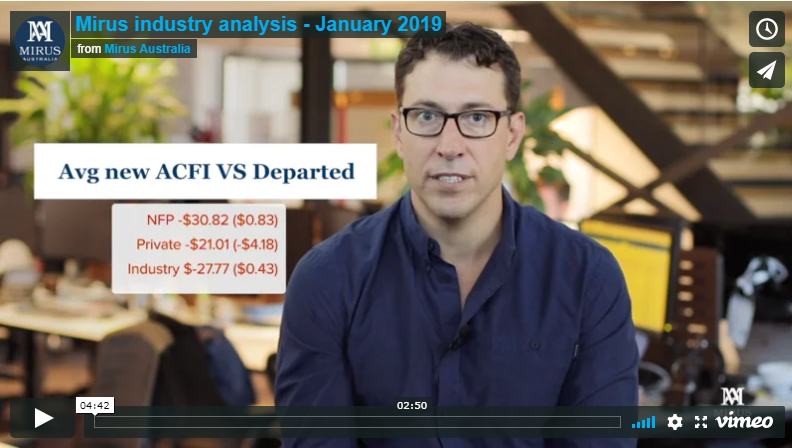
Variance: New Vs Departed ACFI
Within the average ACFIs of new residents and that of the departed ACFIs, we calculate the variance of the ADS between these two segments. The industry average variance between new versus departed ACFI is at $27.77. This figure is much tighter and looks better for the private operators at $21 whereas for the not-for-profits it is at $30.82. For a benchmark level, the Mirus ACFI experts suggest a variance of $20 to be maintained as a good performance indicator for your facility. If you’d like to read more on ACFI optimisation, click here.
Complex Health Care Domain
Within the question 12 and the complex healthcare domain, we’ve seen the 4B and pain management claims to continue to grow across the industry at 46%. The private operators are leading at 47% and the not-for-profits are not too far behind at 45%.
Workforce Trends
The workforce trends had a downward slope too in December 2018 compared to the previous month. Care hours decreased by 6.76% across the industry at 2.4 hours/bed/day and non-care hours also dropped by 8.9% at 0.47 hours/bed/day.
If you would like to get in touch with us please do so here.
Drop in a topic request for our blogs here.
See you next month!
-Team Mirus