Are Star Ratings a summary of your key performance areas?
July 7, 2023 | Aged Care Reform

At the ACCPA conference in WA last week, I presented a breakout session on Star Ratings with the hypothesis they are not just a consumer index but also a summary of the key performance areas of aged care. You can see the slides here.
While this might be controversial to some that tell me they are not concerned about Star Ratings, I think the composite structure of Compliance, Quality Indicators (QI), Care Minutes and ultimately Consumer Experience covers a wide range of performance areas for aged care.
Even the variation on reporting types (in person review against Standards, self-reporting, audited data and survey) allows for a variety of input on performance. It is true that the accuracy of the data has gone through a few teething troubles and the there is a lag in new data coming through to the My Aged Care portal, but the model is new and in time these anomalies will go, and the data publishing will speed up and settle into a normal rhythm.
We have been consulting and providing technology solutions across these areas for over a decade. We therefore feel we are in a privileged position to share our experience and feedback from the many providers we have worked with over the years and particularly in the last 18 months. We produce a Star Rating benchmarking report for every facility in Australia. Its free and available for you here.
Star Ratings Overall
The Star Ratings results for the industry overall show a relatively high average. This should communicate two strong messages to all providers. First, the industry is not doing badly overall on this scale, and it has not been set up to be overly harsh. Most providers I speak to have said this reflects the industry that they know. It’s also important to note that the rating system is set up to expect a 3 star on average. We have been told that the reason that five star is not the expected average is that the only way is down from 5 stars, and it would indicate the parts of the industry that are under achieving but not the parts of the industry that are overachieving. Having 3 star as the average allows for both and this highlights the second point. With so much of the industry at 3 and 4 stars, for the facilities sitting at 1 and 2 stars overall, they are very much on the radar for the Department and the Quality and Safety Commission.
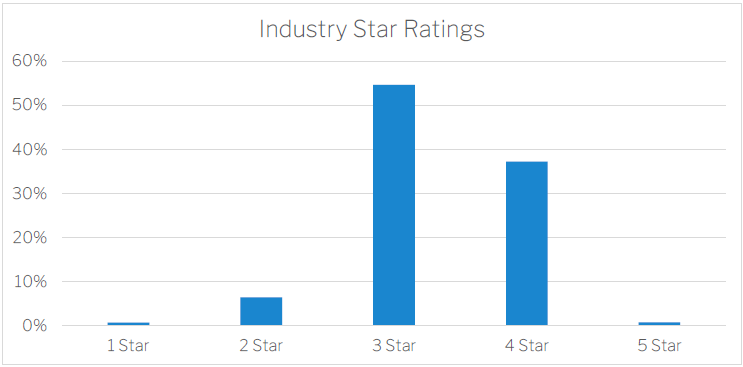
Across the 4 performance areas, the industry averages provide an interesting perspective for any individual facility’s results. It’s hard to say at this point where these averages should go to, but it is interesting to note they are all above the target average of 3 stars. This does indicate however that there are many facilities below these averages and therefore these will also be the target of further attention from the Department and Quality Commission.
Residents’ Experience
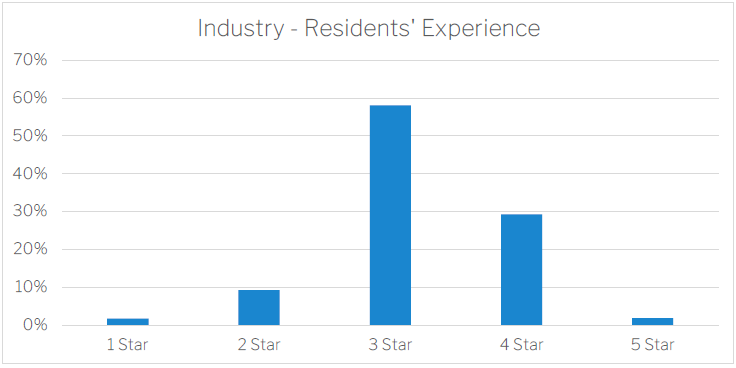
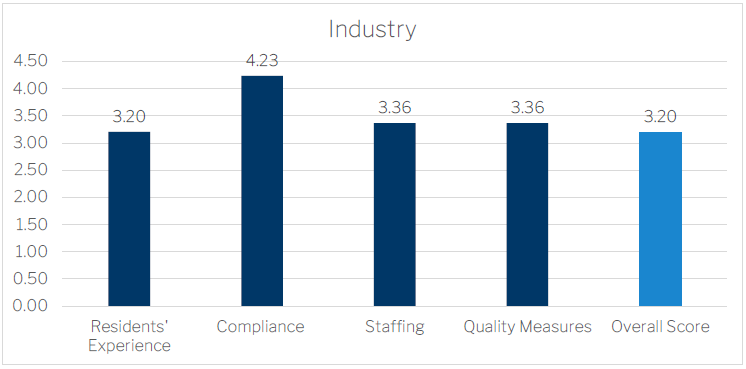
Resident experience results follow the pattern of 3 and 4 stars. For this indicator it is important to note two things. Firstly, this is an indicator that is much harder and much slower to measure with in person surveys being performed and updated on an annual basis. The second is that the questions being asked, and the sample of residents taken (approximately 20%) can create some subjectivity. Examples of this are the questions “Is this place well run?” where the resident may not fully understand the complexity of a facility or “Do you like the food here?” where a response of “Always” is probably difficult for many people in any context. This last question is the poorest performing question by far at 27% always, some 11% lower than the next lowest performing question. Food and Nutrition is going to be called out specifically as a new Standard under the revised quality standards.
The top 3 performing questions are “Do staff treat you with respect?”, “Do you feel safe here?”, and “Are staff kind and caring?” with 65-73% measuring always and with most of the time taking these to 90-95% each.
Two of the lowest performing questions are “Do the staff explain things to you?” and “Do staff follow up when you raise things with them?”. The good news is these are two questions that can be addressed with some internal training and better communication.
Compliance
The compliance indicator is one of the standout performers with most of the industry over 3 stars and a significant proportion at 5 stars. This information is based on regulatory decision by the Aged Care Quality and Safety Commission including compliance with the Aged Care Quality Standards. It is based on the type of compliance factor or period without non-compliance decision. The industry currently has an average compliance rating of 4.23 stars.
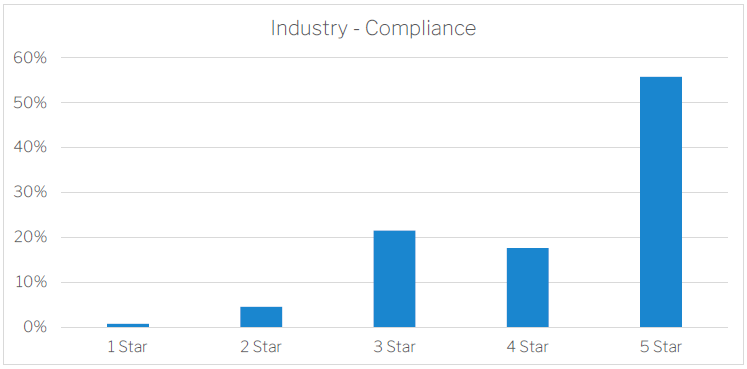

Over the past four quarters requirement 3(3)(a) Safe and effective personal and clinical care has been found to be the most frequently non-complaint requirement.
The top 10 most frequently found non-compliant requirements interlink, for example; 3(3)(a) Safe & effective personal and clinical care directly relates to 7(3)(a) Number and mix of workforce, resulting in this requirement being in the top 10 consistently over the same reporting period.
For sector performance reports visit: https://www.agedcarequality.gov.au/sector-performance
However, the landscape of compliance is changing with the Strengthened Quality Standards, which is expected to have a go-live date of 1 July 2024.
Most recent Strengthened Quality Standards was released on 30 May 2023 – Strengthened Aged Care Quality Standards – Pilot Program
So, what does this mean for providers?
The Department released a framework analysis on the Strengthened Quality Standards and has advised the auditing process for the Strengthened Quality Standards will include a digital / virtual audit along with on-site visits. So, while there is hesitancy being reported to commence transitions plans, providers should be thinking about their current systems and testing them to ensure they remain fit for purpose. Now is also the time to commence gap analysis to identify areas for improvement.
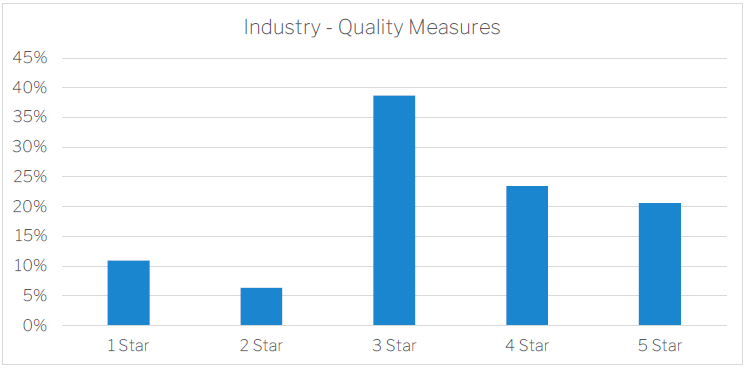
Quality Measures
The QI in the Star Ratings show a much broader distribution. Calculated on benchmarking quintiles the distribution is shown below. In principle, the quality measures target aspects of health and wellbeing that are more likely to affect older people but can be minimised when good quality care is provided. This is a view that is sometimes debated as some of the QI can be subjective or competing with other policy requirements such as consumer choice (like the choice to move around unaided and potentially fall). The average rating for the industry is approximately 3.36 stars.
Under the new QI reporting, providers should already be capturing data on the additional QI components. Feedback from our clients suggests there was initial concern about their capacity to undertake additional assessments and surveys using their current workforce which impacts their ability to manage this reporting internally.
Our clients shared that their Lifestyle or Activities employees were identified quickly to support the undertaking of surveys in order to best capture data for the reporting purpose, though this additional workload would take away time from lifestyle programs.
Clients also raised concerns about workforce skills and the need to roll out education programs for clinical staff in order for them to effectively complete the clinical assessment component which includes the Barthel Index of Activities of Daily Living and the Ghent Global Incontinence-associated dermatitis categorisation tool – both of which have not previously been widely used within the sector.
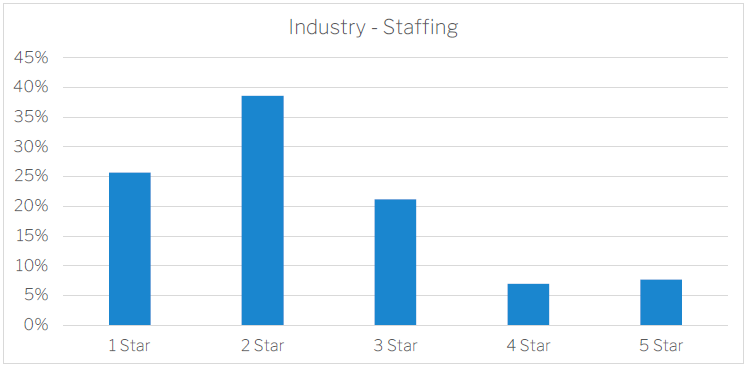
Staffing
The Staffing rating considers the average amount of care delivered per resident per day compared to a target for total care time and for registered nurses specifically. Currently as a total, the industry is delivering 96.85% of care minutes and 94.85% of RN time.
There are two important points to note at this time.
Firstly, there are several ways to meet care minute requirements and the star ratings associated with different levels of care and RN minutes. It is very important that providers understand these thresholds as the path to compliance may be different for different services. Even though Star Ratings is NOT care minute compliance, the Commission has stated on several occasions that it will look at the Star Ratings framework and the distribution of providers in the 1 and 2 star categories as a priority. They have also stated they will take into consideration other mitigating factors like the effort to achieve higher staffing and other risk mitigation tactics (such as use of RNs and not ENs) to determine the overall risk created by not being compliant in care minutes.
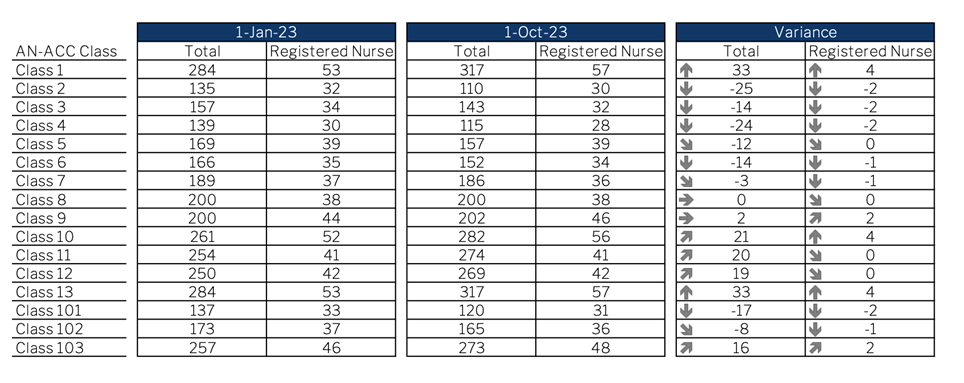
The second point to note is that the Relative Value Units (RVUs), which are the weightings used to calculate care minutes from individual AN-ACC classifications, are changing on October 1. The Department has confirmed to Mirus recently that these RVUs will continue to change from time to time as they adjust the model to fit requirements. This means that on October 1 your class mix could drive a significant shift in your care minutes either in your favour or against. It could also move very little as it depends on how your individual distribution of classifications matches the changing RVUs as tabled below.
Mirus has a free FY24 Budgeting reforecasting report that is available here and will help you to understand the impact of these changes on each facility.
So, in summary, the Star Ratings model and algorithm provides the industry with far more than just a consumer index. As a four-component index, it is also a multi-faceted view of many of the key performance areas of an Aged Care business. Arguably one important area it does not focus on is revenue and rather focuses on most areas of cost. These two drivers (revenue and cost) combined naturally drive financial sustainability which in turn determines the long-term capacity for a provider to provide great care.
For more information on any of these areas and to access the two free reports, please contact the Mirus team.